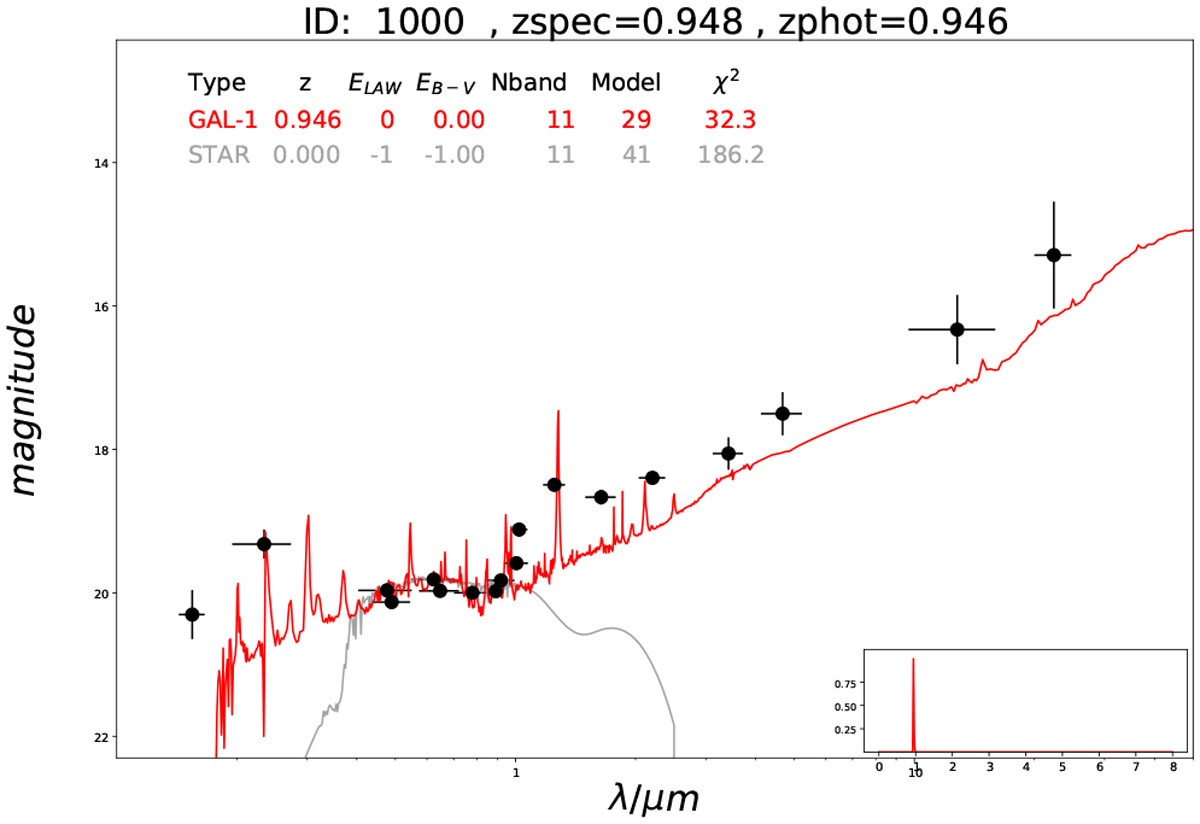
Fig. C.1
Download original image
Example of SED fitting and redshift probability distribution (in the inset). The photometric points and their errors are indicated with black points. The best extragalactic and Galactic templates are shown with a solid line. The plot and the data to create the plots are available upon request.
Current usage metrics show cumulative count of Article Views (full-text article views including HTML views, PDF and ePub downloads, according to the available data) and Abstracts Views on Vision4Press platform.
Data correspond to usage on the plateform after 2015. The current usage metrics is available 48-96 hours after online publication and is updated daily on week days.
Initial download of the metrics may take a while.