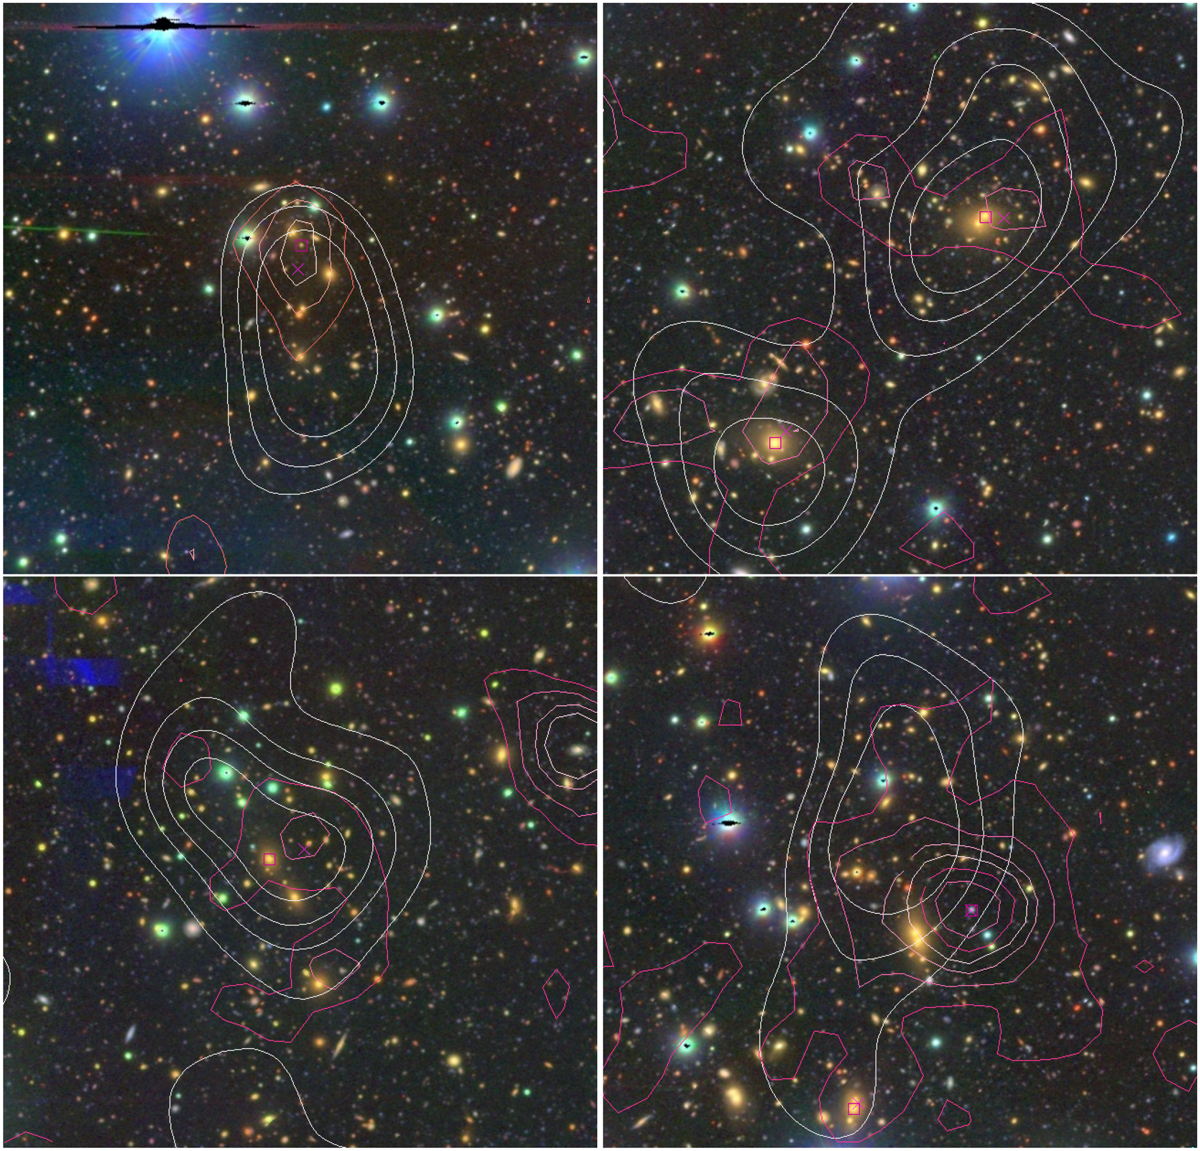
Fig. 17
Download original image
Top left, clock-wise: four examples of Cluster_Class = 5,4,3,2, as described in Sect. 7.5. X-ray contours are plotted in white. The magenta cross indicates the X-ray position, and the magenta square indicates the counterpart selected in this paper. Magenta contours indicate the red-sequence galaxy density. The HSC g, r, i cutouts are 5.5’ × 5.5’ in size.
Current usage metrics show cumulative count of Article Views (full-text article views including HTML views, PDF and ePub downloads, according to the available data) and Abstracts Views on Vision4Press platform.
Data correspond to usage on the plateform after 2015. The current usage metrics is available 48-96 hours after online publication and is updated daily on week days.
Initial download of the metrics may take a while.