Fig. 9
Download original image
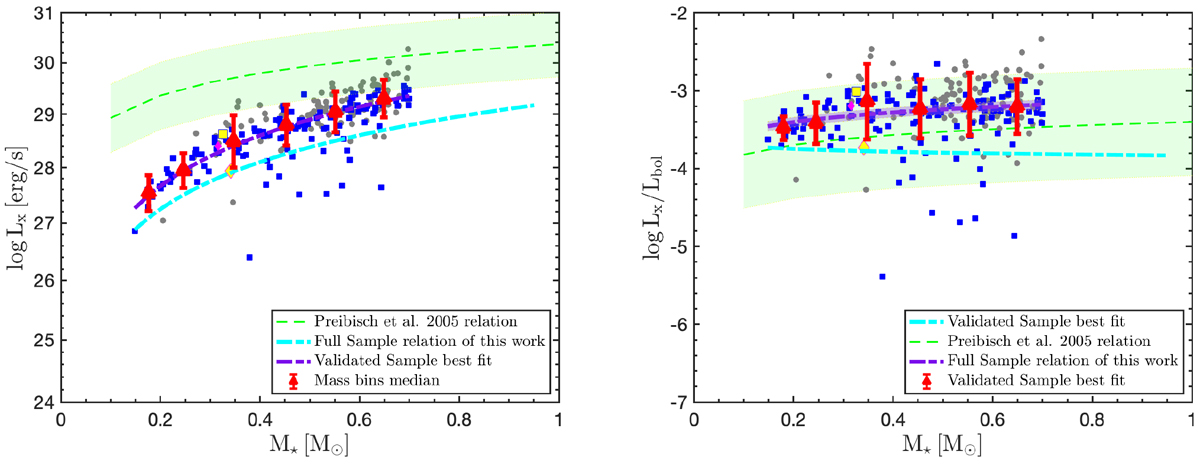
X-ray activity vs mass for the validated samples (see legend in Figs. 7 and 8) restricted to the saturated stars, i.e., stars with Prot ≤ 8.5 d, best fit (violet) and median plus standard deviation of the data (red) in bins of 0.1 M⊙. The fit to the young stars in the Orion Nebular cluster provided by (Preibisch et al. 2005) is also shown, together with the standard deviation of this fit (green) and the best fit we found for the full M dwarf sample presented in the top panels of Fig. 7 (cyan). Left: X-ray luminosity vs. mass. Right: X-ray over bolometric luminosity vs. mass.
Current usage metrics show cumulative count of Article Views (full-text article views including HTML views, PDF and ePub downloads, according to the available data) and Abstracts Views on Vision4Press platform.
Data correspond to usage on the plateform after 2015. The current usage metrics is available 48-96 hours after online publication and is updated daily on week days.
Initial download of the metrics may take a while.