Fig. 7
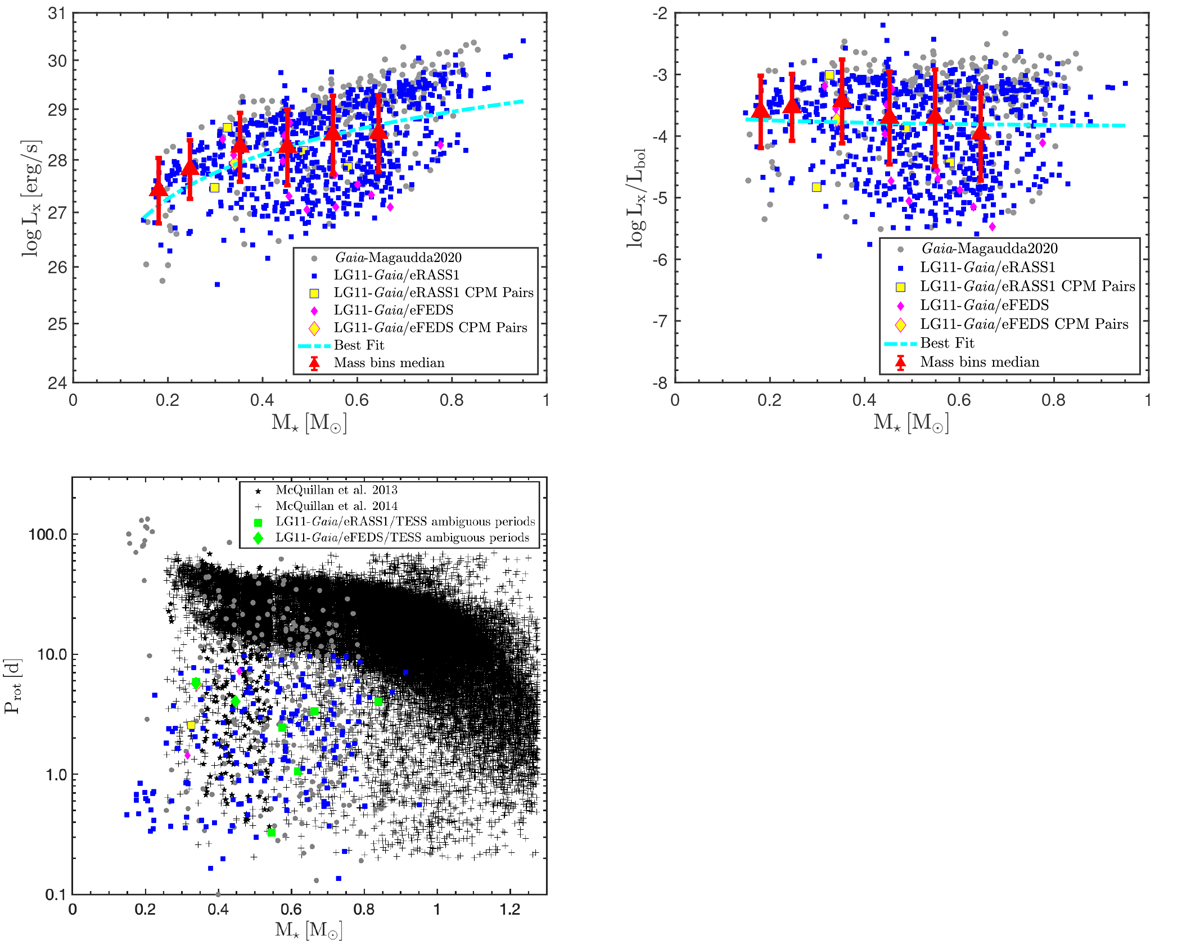
Download original image
X-ray activity and rotation vs. mass: blue and pink show the eRASS1 and eFEDS M dwarf samples, respectively, and gray shows the revised sample from (Magaudda et al. 2020); see the legend inside the panels for other literature data and highlighted specific subsamples. In the top panels, the median and the standard deviation of the data are presented in red for bins with a width of 0.1 M⊙. Top left: X-ray luminosity vs. mass and best fit (cyan). Top right: X-ray over bolometric luminosity vs. mass and best fit (cyan). Bottom left: rotation period vs mass; for the stars with double-humped TESS light curves, the shorter of the two periods is shown.
Current usage metrics show cumulative count of Article Views (full-text article views including HTML views, PDF and ePub downloads, according to the available data) and Abstracts Views on Vision4Press platform.
Data correspond to usage on the plateform after 2015. The current usage metrics is available 48-96 hours after online publication and is updated daily on week days.
Initial download of the metrics may take a while.