Fig. 3
Download original image
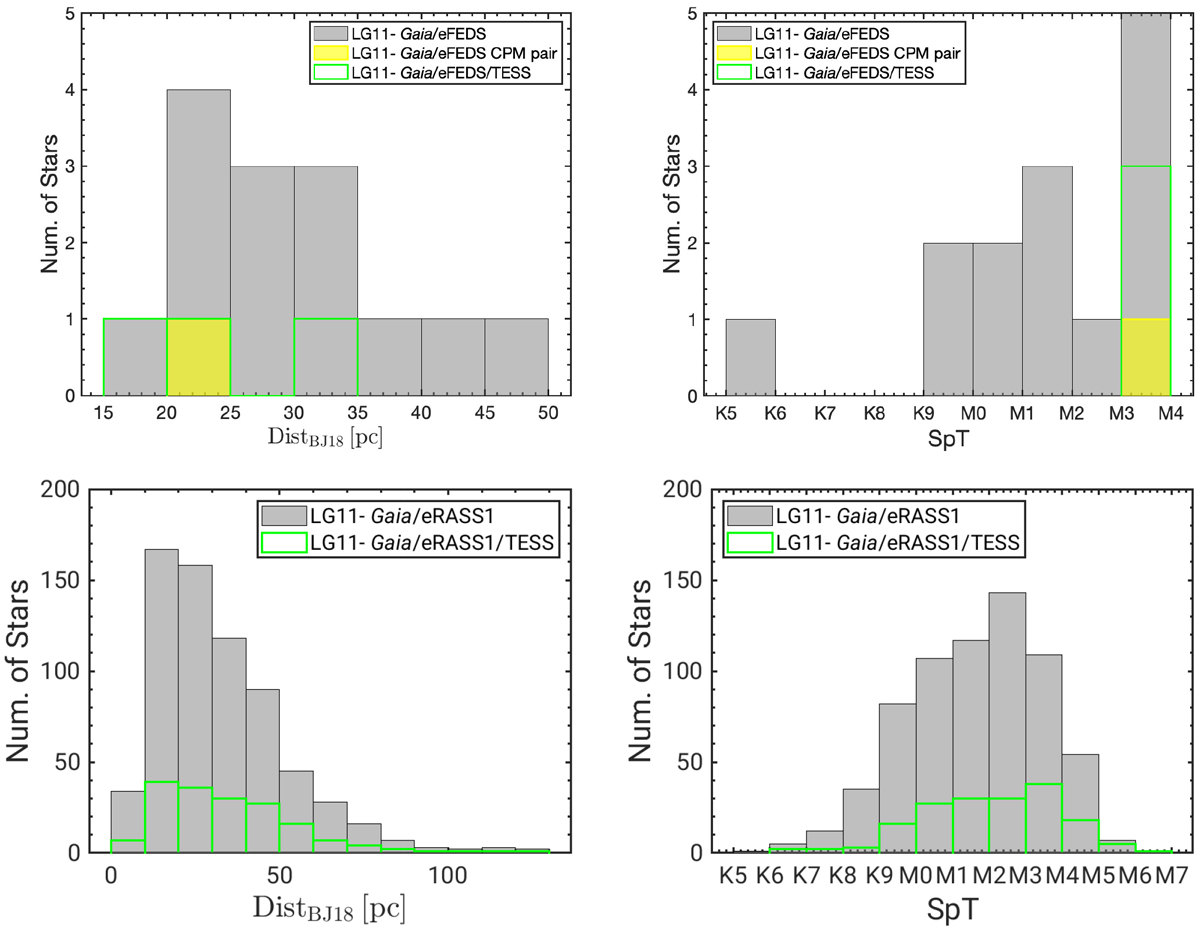
Distribution of Gaia distances from (Bailer-Jones et al. 2018) and spectral types calculated from Gbp – Grp. Top panel: gray histogram is the distribution for the stars from LG11-Gaia in the eFEDS fields. The green contours represent the distance and SpT distribution for those stars observed by TESS. We show the CPM pairs in yellow. Bottom panel: stars from the LG11-Gaia sample identified in the preliminary eRASS1 catalog. For simplicity, we do not show the four CPM pairs here because they represent only 4% of the sample.
Current usage metrics show cumulative count of Article Views (full-text article views including HTML views, PDF and ePub downloads, according to the available data) and Abstracts Views on Vision4Press platform.
Data correspond to usage on the plateform after 2015. The current usage metrics is available 48-96 hours after online publication and is updated daily on week days.
Initial download of the metrics may take a while.