Fig. 13
Download original image
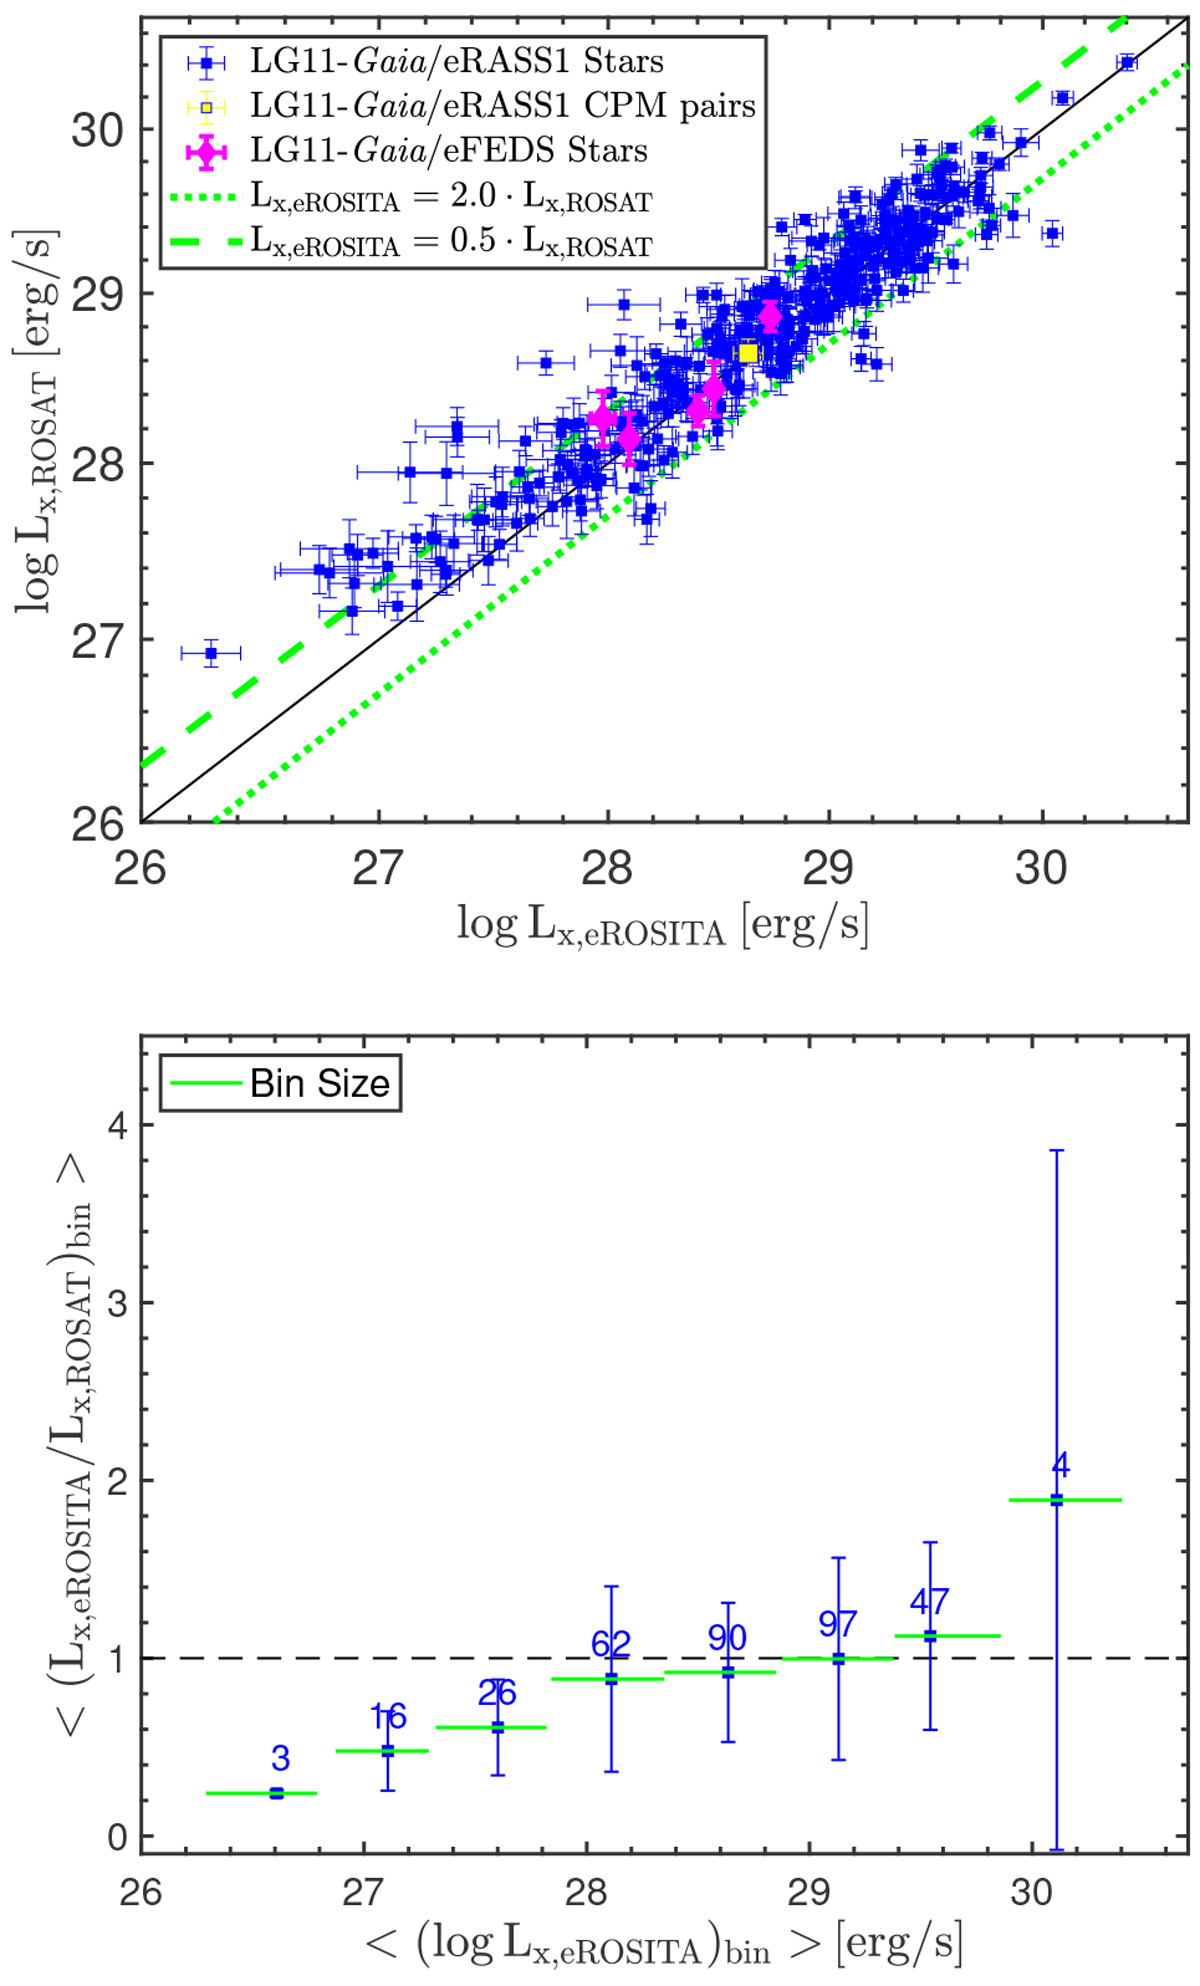
Comparison between the X-ray luminosities from eROSITA (eRASS1 and eFEDS) and those from ROSAT (RASS) for the LG11-Gaia sample. Top panel: scatter plot. CPM pairs are highlighted in yellow. Bottom panel: ratio of the eROSITA and ROSAT luminosities in logarithmic bins of width 0.5 in X-ray luminosity, quantifying the systematic trend. Labels at the tops of the data points represent the number of stars in each bin. The vertical bars are the standard deviations, and the horizontal bars denote the bin width.
Current usage metrics show cumulative count of Article Views (full-text article views including HTML views, PDF and ePub downloads, according to the available data) and Abstracts Views on Vision4Press platform.
Data correspond to usage on the plateform after 2015. The current usage metrics is available 48-96 hours after online publication and is updated daily on week days.
Initial download of the metrics may take a while.