Fig. 9
Download original image
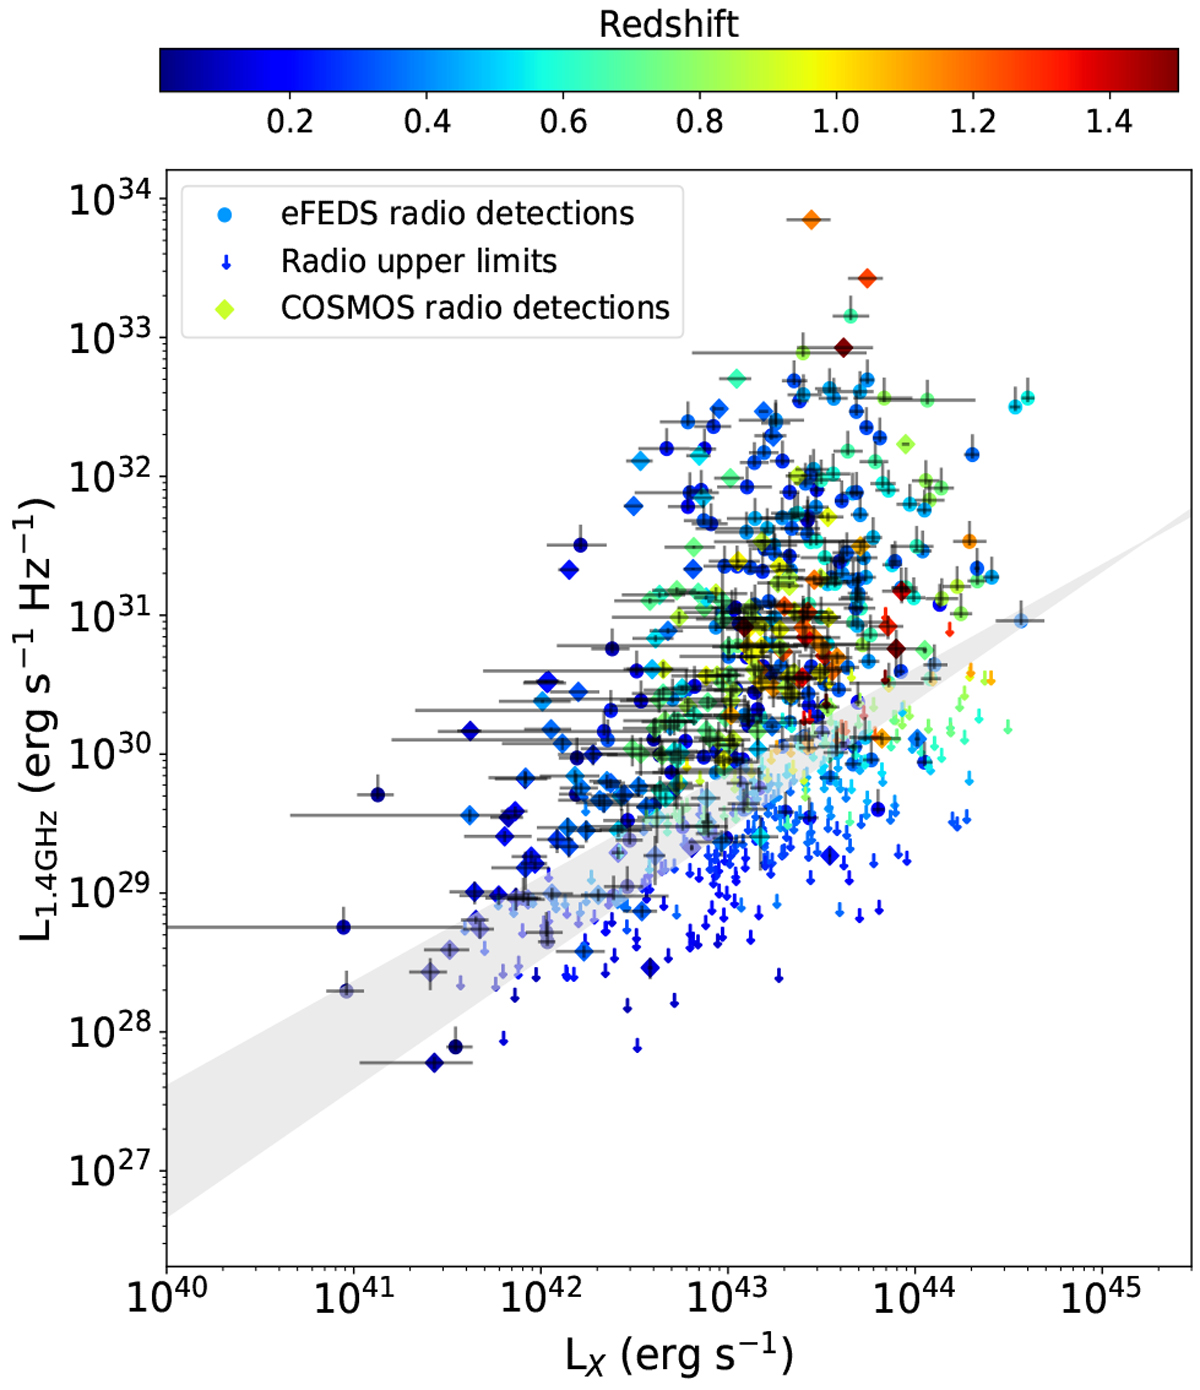
1.4 GHz power of radio galaxies vs. X-ray luminosity of the host cluster for the eFEDS and P20 samples. The colours correspond to the redshift. eFEDS data are represented by circles, while diamonds are COSMOS systems. Downward-pointing arrows denote radio upper limits. Bars represent errors on both axes. Errors on the y-axis are dominated by the assumed uncertainty on the spectral index. The best-fit relation is shown in grey: log LR = (0.84 ± 0.09) log LX−(6.46 ± 4.07).
Current usage metrics show cumulative count of Article Views (full-text article views including HTML views, PDF and ePub downloads, according to the available data) and Abstracts Views on Vision4Press platform.
Data correspond to usage on the plateform after 2015. The current usage metrics is available 48-96 hours after online publication and is updated daily on week days.
Initial download of the metrics may take a while.