Fig. 7
Download original image
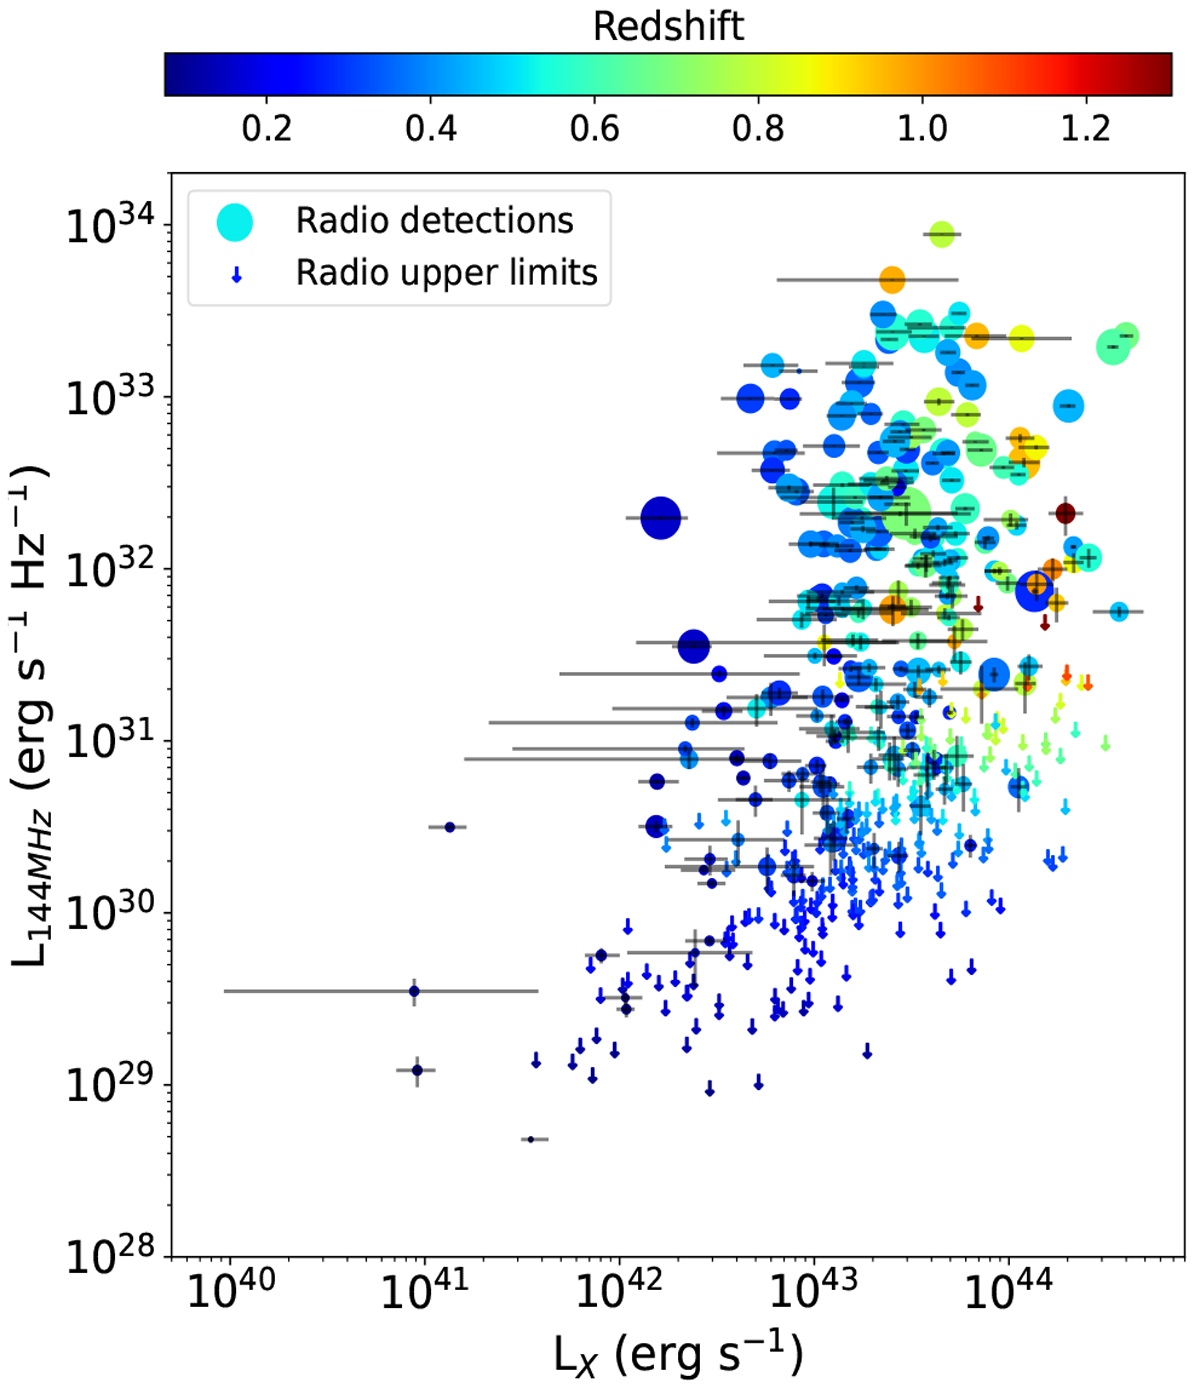
144 MHz power of radio galaxies vs. X-ray luminosity of the host cluster. Symbol sizes are proportional to the LLS of the source, and their colour indicates the redshift. Downward-pointing arrows denote radio upper limits. Bars represent errors on both axes.
Current usage metrics show cumulative count of Article Views (full-text article views including HTML views, PDF and ePub downloads, according to the available data) and Abstracts Views on Vision4Press platform.
Data correspond to usage on the plateform after 2015. The current usage metrics is available 48-96 hours after online publication and is updated daily on week days.
Initial download of the metrics may take a while.