Fig. 3
Download original image
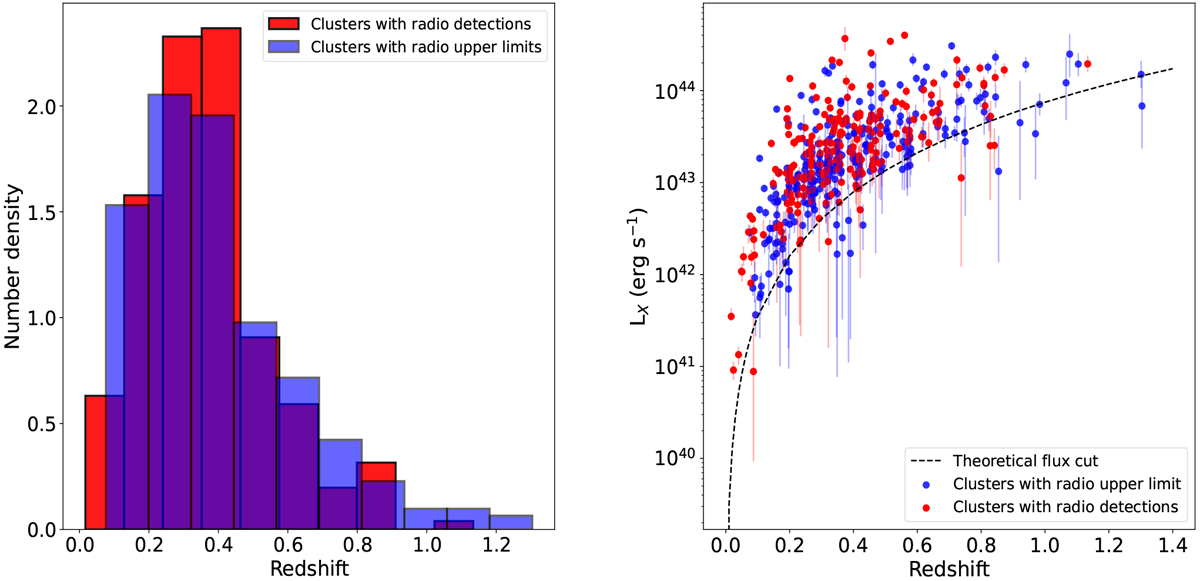
Left: histogram showing the redshift distribution of the sample, classified into radio detections (red) and upper limits (blue). Right: LX500 vs. redshift for the sample. The dashed line denotes the theoretical flux cut of the eROSITA observation.
Current usage metrics show cumulative count of Article Views (full-text article views including HTML views, PDF and ePub downloads, according to the available data) and Abstracts Views on Vision4Press platform.
Data correspond to usage on the plateform after 2015. The current usage metrics is available 48-96 hours after online publication and is updated daily on week days.
Initial download of the metrics may take a while.