Fig. 2
Download original image
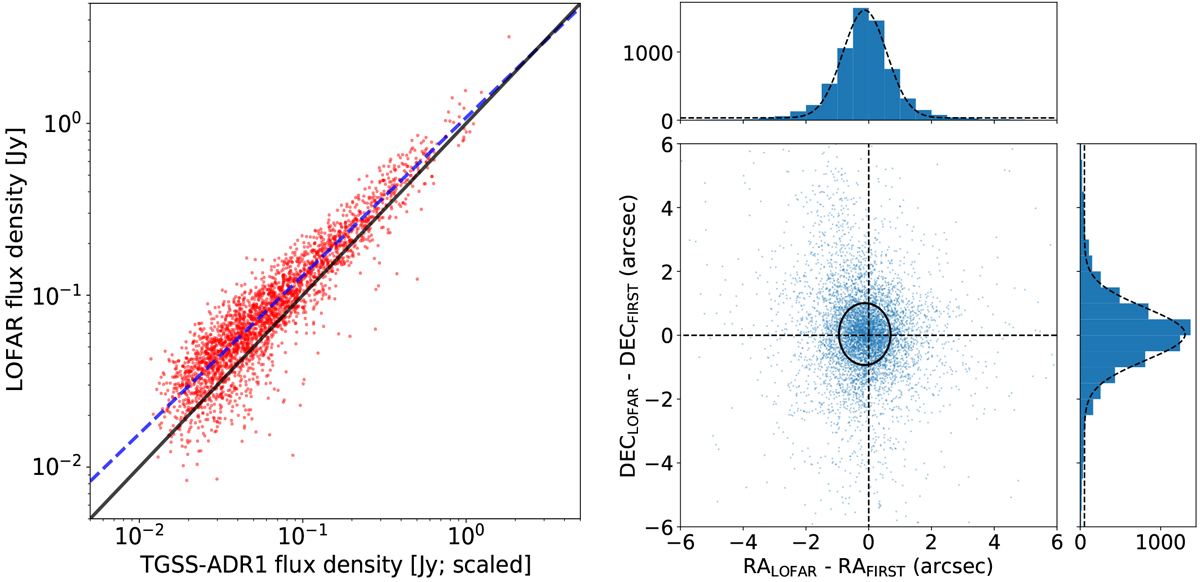
Left: scatter plot between the TGSS-ADR1 (scaled) and LOFAR flux densities for single-Gaussian sources. The dashed blue line is the best fit of the LOFAR and TGSS-ADR1 (scaled) flux densities, log10 (SlOfar) = 0.92 × log10 (STGSS-ADRI;scaled) + 0.03 (Jy). The solid black line is a diagonal line with slope 1. Right: RA and Dec offsets for the LOFAR and FIRST detected single-Gaussian sources. The histograms of the offsets, including the best-fit Gaussian dashed lines, are plotted in the top and right panels. The ellipse shows the peak location (i.e. 0.13″ to the left and 0.04″ to the top of the centre point) and the FWHM (i.e. 0.70″ and 0.82″ in RA and Dec) of the Gaussian functions that are obtained from the fitting of the RA and Dec offset histograms.
Current usage metrics show cumulative count of Article Views (full-text article views including HTML views, PDF and ePub downloads, according to the available data) and Abstracts Views on Vision4Press platform.
Data correspond to usage on the plateform after 2015. The current usage metrics is available 48-96 hours after online publication and is updated daily on week days.
Initial download of the metrics may take a while.