Fig. A.1
Download original image
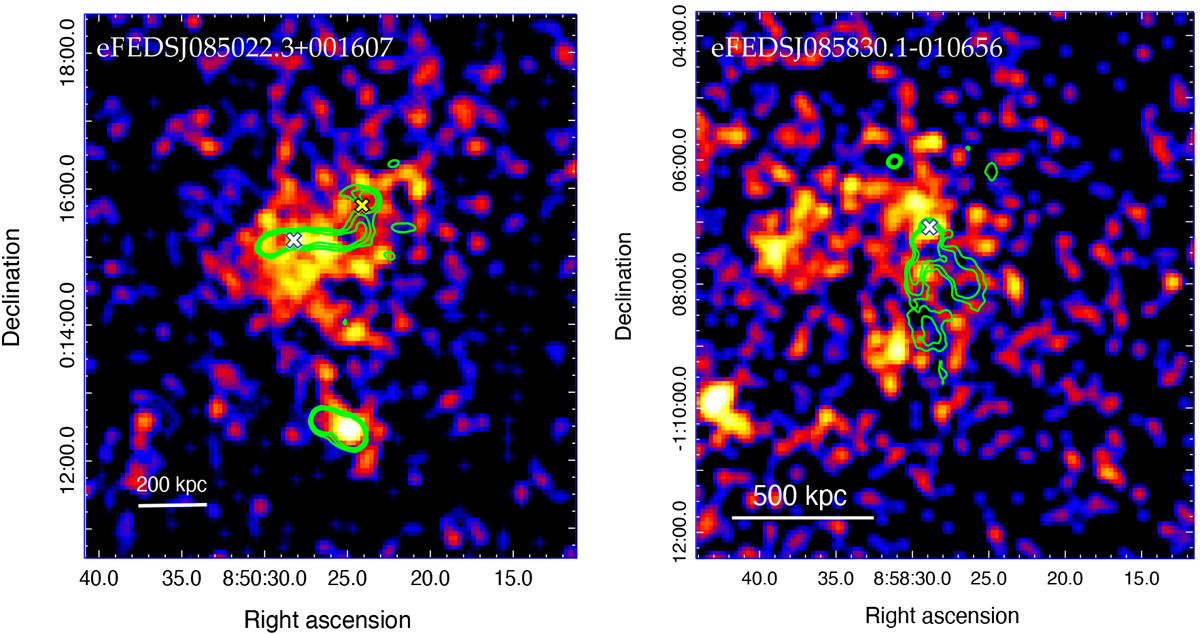
eROSITA 0.2-2.3 keV images of eFEDSJ085022.3+001607 (left panel) and eFEDSJ085830.1-010656 (right panel), smoothed with a 3σ Gaussian filter. LOFAR 144 MHz contours at 3, 6, 12, 24 × rms (local) are plotted in green. The white cross represents the cluster X-ray peak, and the yellow cross is the BCG position. For eFEDSJ085830.1-010656, the BCG is coincident with the X-ray peak.
Current usage metrics show cumulative count of Article Views (full-text article views including HTML views, PDF and ePub downloads, according to the available data) and Abstracts Views on Vision4Press platform.
Data correspond to usage on the plateform after 2015. The current usage metrics is available 48-96 hours after online publication and is updated daily on week days.
Initial download of the metrics may take a while.