Fig. 10
Download original image
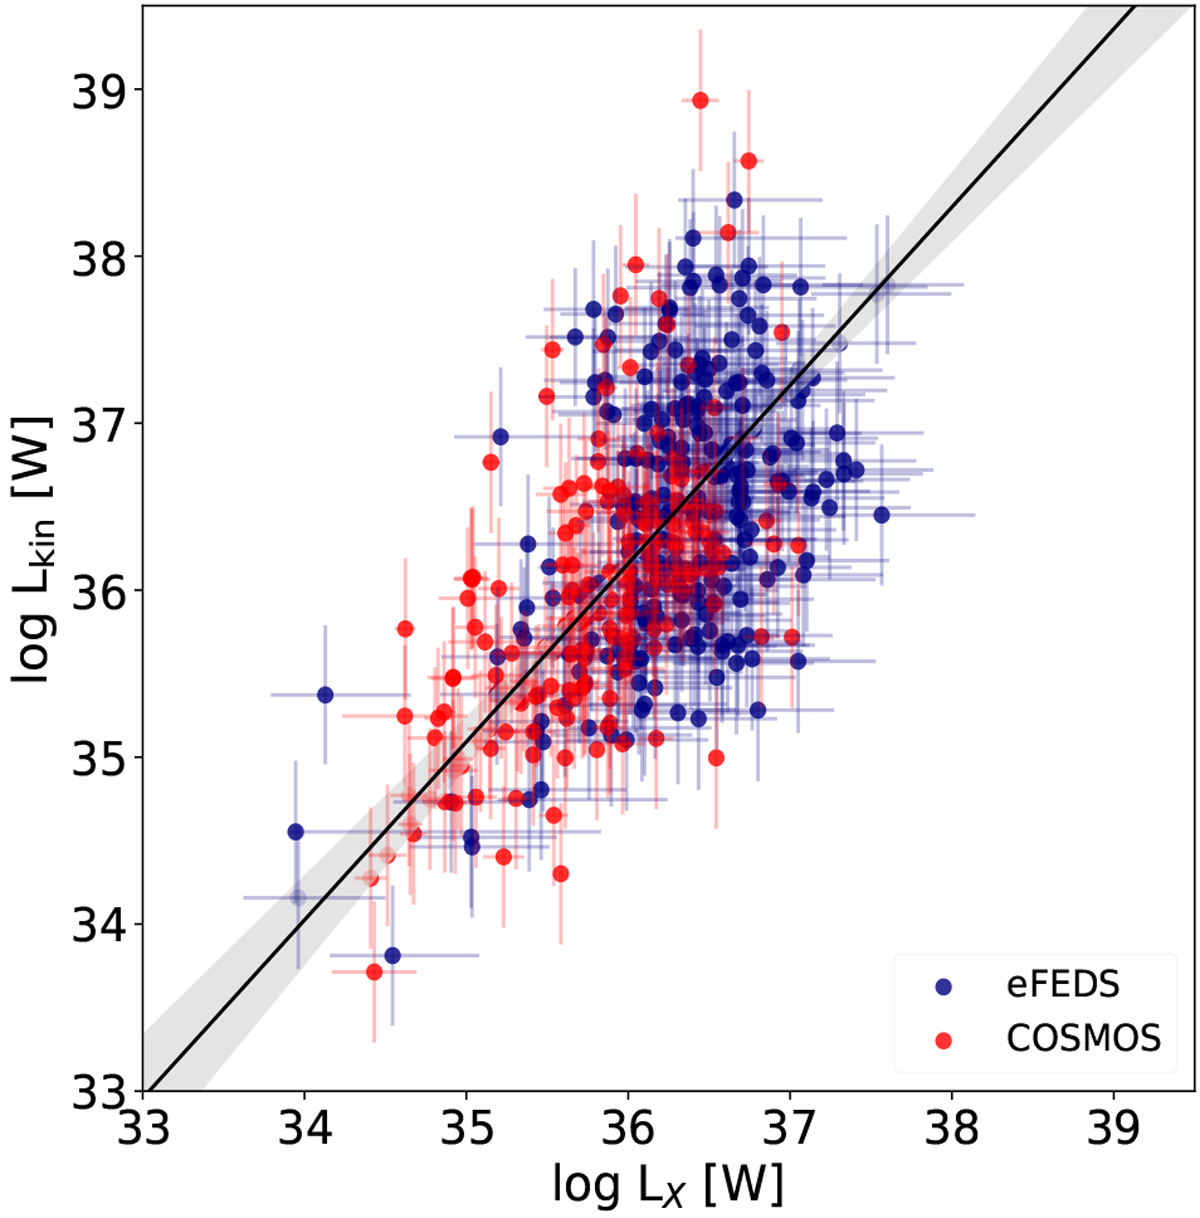
Kinetic luminosity of BCG radio galaxies estimated at 1.4 GHz vs. X-ray luminosity of the host cluster or group for the eFEDS (blue) and P20 (red) samples. The black line represents the best-fit estimated from Bayesian inference: log Lkin = (1.07 ± 0.11)log LX−(2.19 ± 4.05). The grey area indicates 1σ errors.
Current usage metrics show cumulative count of Article Views (full-text article views including HTML views, PDF and ePub downloads, according to the available data) and Abstracts Views on Vision4Press platform.
Data correspond to usage on the plateform after 2015. The current usage metrics is available 48-96 hours after online publication and is updated daily on week days.
Initial download of the metrics may take a while.