Fig. 9
Download original image
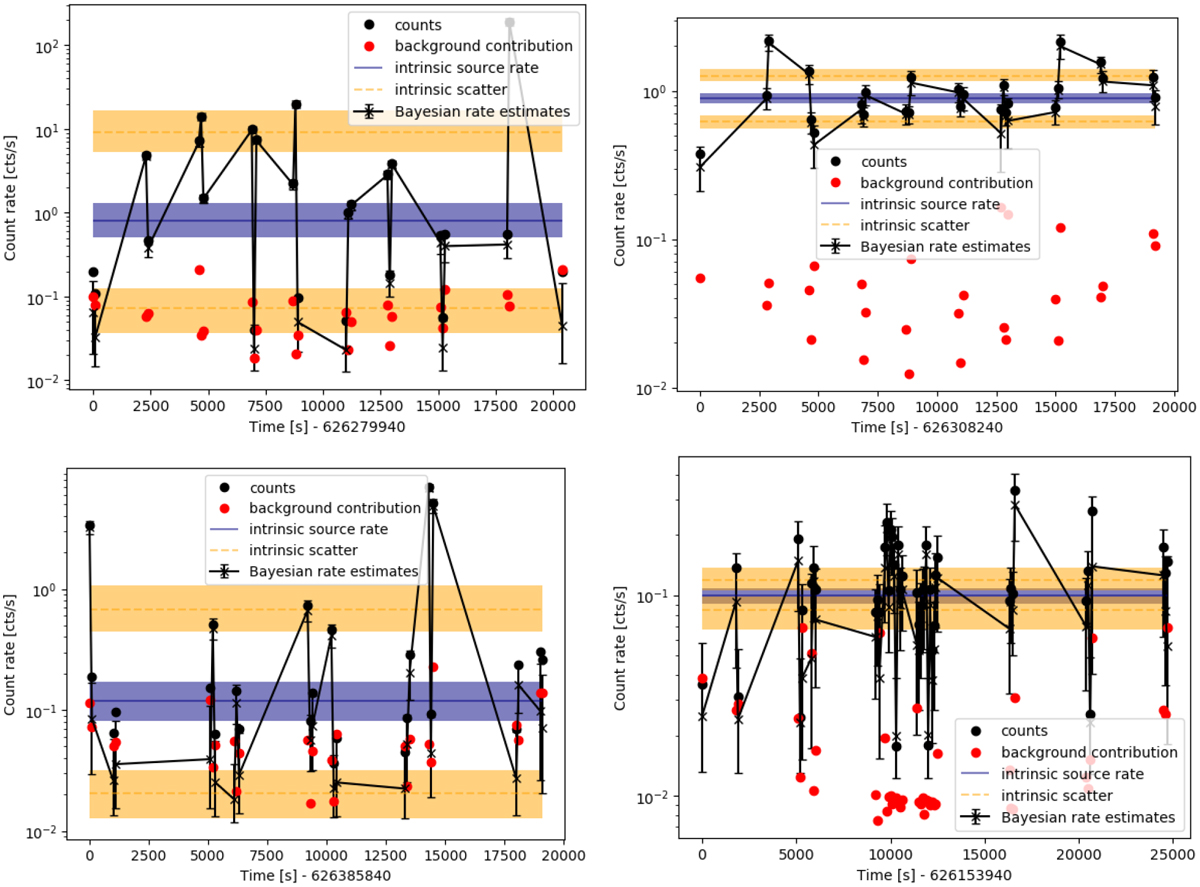
As in Fig. 8, but for gaussvar sources. The intrinsic count rate is randomly varied following a log-normal distribution around a baseline count rate. Left panels: cases with σ = 1dex variations, clearly visible in the scatter of the total counts (black points) in both bright (top panel) and faint (bottom panel) sources. Right panels: lower variations (σ = 0.1 dex). In the bright case (top panel), the scatter of the black points is substantially larger than the error bars, while in the faint case (bottom), the error bars overlap. In the top panel the background contribution (red points) is well below the total counts (black), while in the bottom panel, they are comparable. The solid blue line and band show the posterior median and 1a uncertainty of the intrinsic source count rate ![]() , computed using the bexvar method. The intrinsic scatter around the mean, σbexvar, is shown as dashed orange lines, indicating the upper and lower 1 a of the estimated log-Gaussian. The uncertainties on abexvar are shown as orange bands. In all but the bottom right panel, the orange band is clearly separated from the blue band (indicating significant intrinsic variability).
, computed using the bexvar method. The intrinsic scatter around the mean, σbexvar, is shown as dashed orange lines, indicating the upper and lower 1 a of the estimated log-Gaussian. The uncertainties on abexvar are shown as orange bands. In all but the bottom right panel, the orange band is clearly separated from the blue band (indicating significant intrinsic variability).
Current usage metrics show cumulative count of Article Views (full-text article views including HTML views, PDF and ePub downloads, according to the available data) and Abstracts Views on Vision4Press platform.
Data correspond to usage on the plateform after 2015. The current usage metrics is available 48-96 hours after online publication and is updated daily on week days.
Initial download of the metrics may take a while.