Fig. 7
Download original image
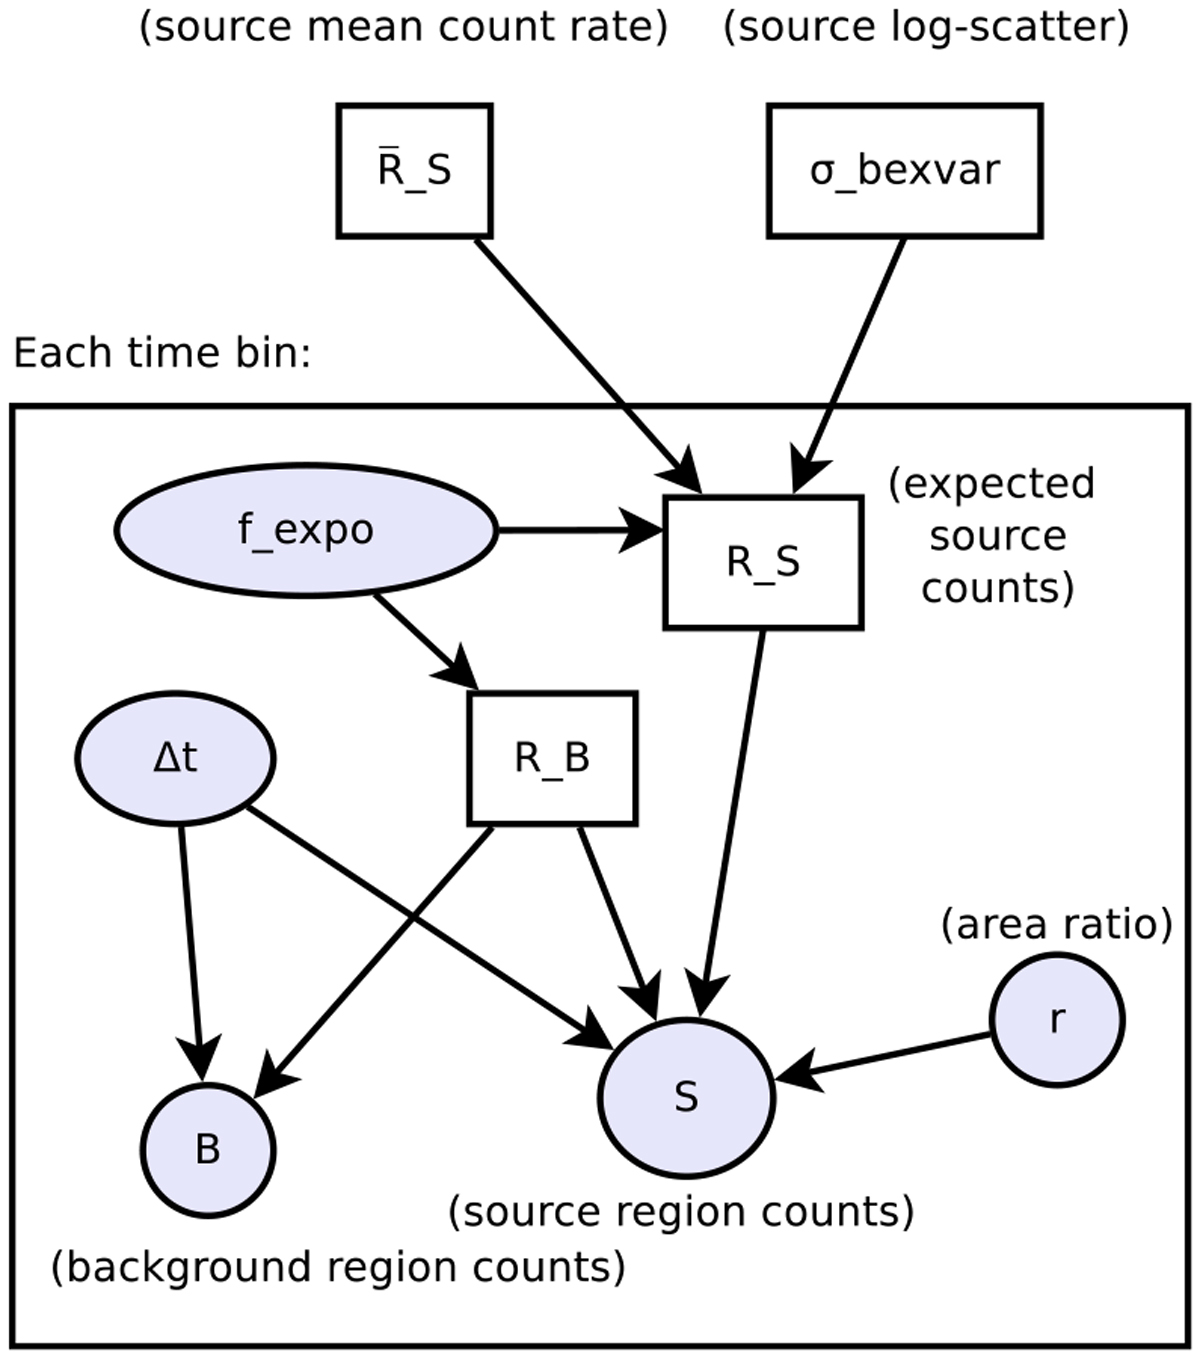
Graphical model of the Bayesian excess variance method. Shaded circles indicate known values, related to the experiment setup or observed data. Rectangles indicate unknown parameters, including the unknown source count rate and the count rate in each time bin. An arrow from A to B indicates that the generation of B was influenced by A.
Current usage metrics show cumulative count of Article Views (full-text article views including HTML views, PDF and ePub downloads, according to the available data) and Abstracts Views on Vision4Press platform.
Data correspond to usage on the plateform after 2015. The current usage metrics is available 48-96 hours after online publication and is updated daily on week days.
Initial download of the metrics may take a while.