Fig. 5
Download original image
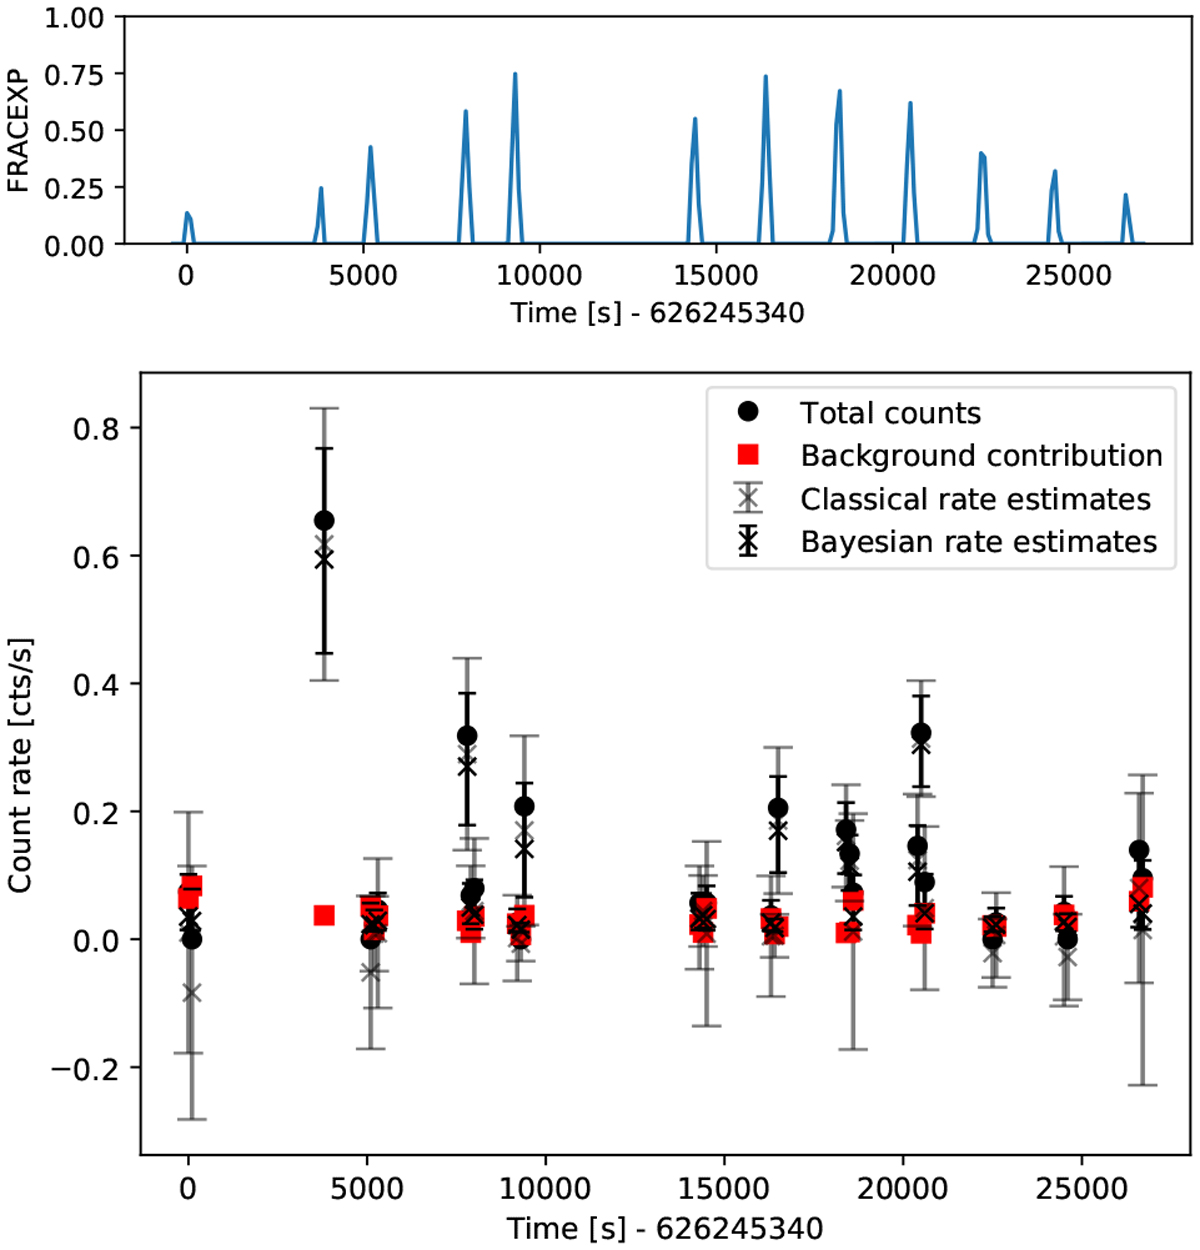
Visualisations. Top panel: fractional exposure over time for an example source with 10 passes. Bottom panel: light curve of a simulated source with constant count rate and a bright flare. Black circles show the total counts without background subtraction, and red points show the expected background count rates in the source region (Eq. (4)). Grey error bars show classical net source count-rate estimates (Eqs. (3) and (5)). Black error bars show Bayesian net source count-rate posterior distributions, represented visually with 10, 50, and 90% quantiles under a log-uniform prior (Eq. (7)).
Current usage metrics show cumulative count of Article Views (full-text article views including HTML views, PDF and ePub downloads, according to the available data) and Abstracts Views on Vision4Press platform.
Data correspond to usage on the plateform after 2015. The current usage metrics is available 48-96 hours after online publication and is updated daily on week days.
Initial download of the metrics may take a while.