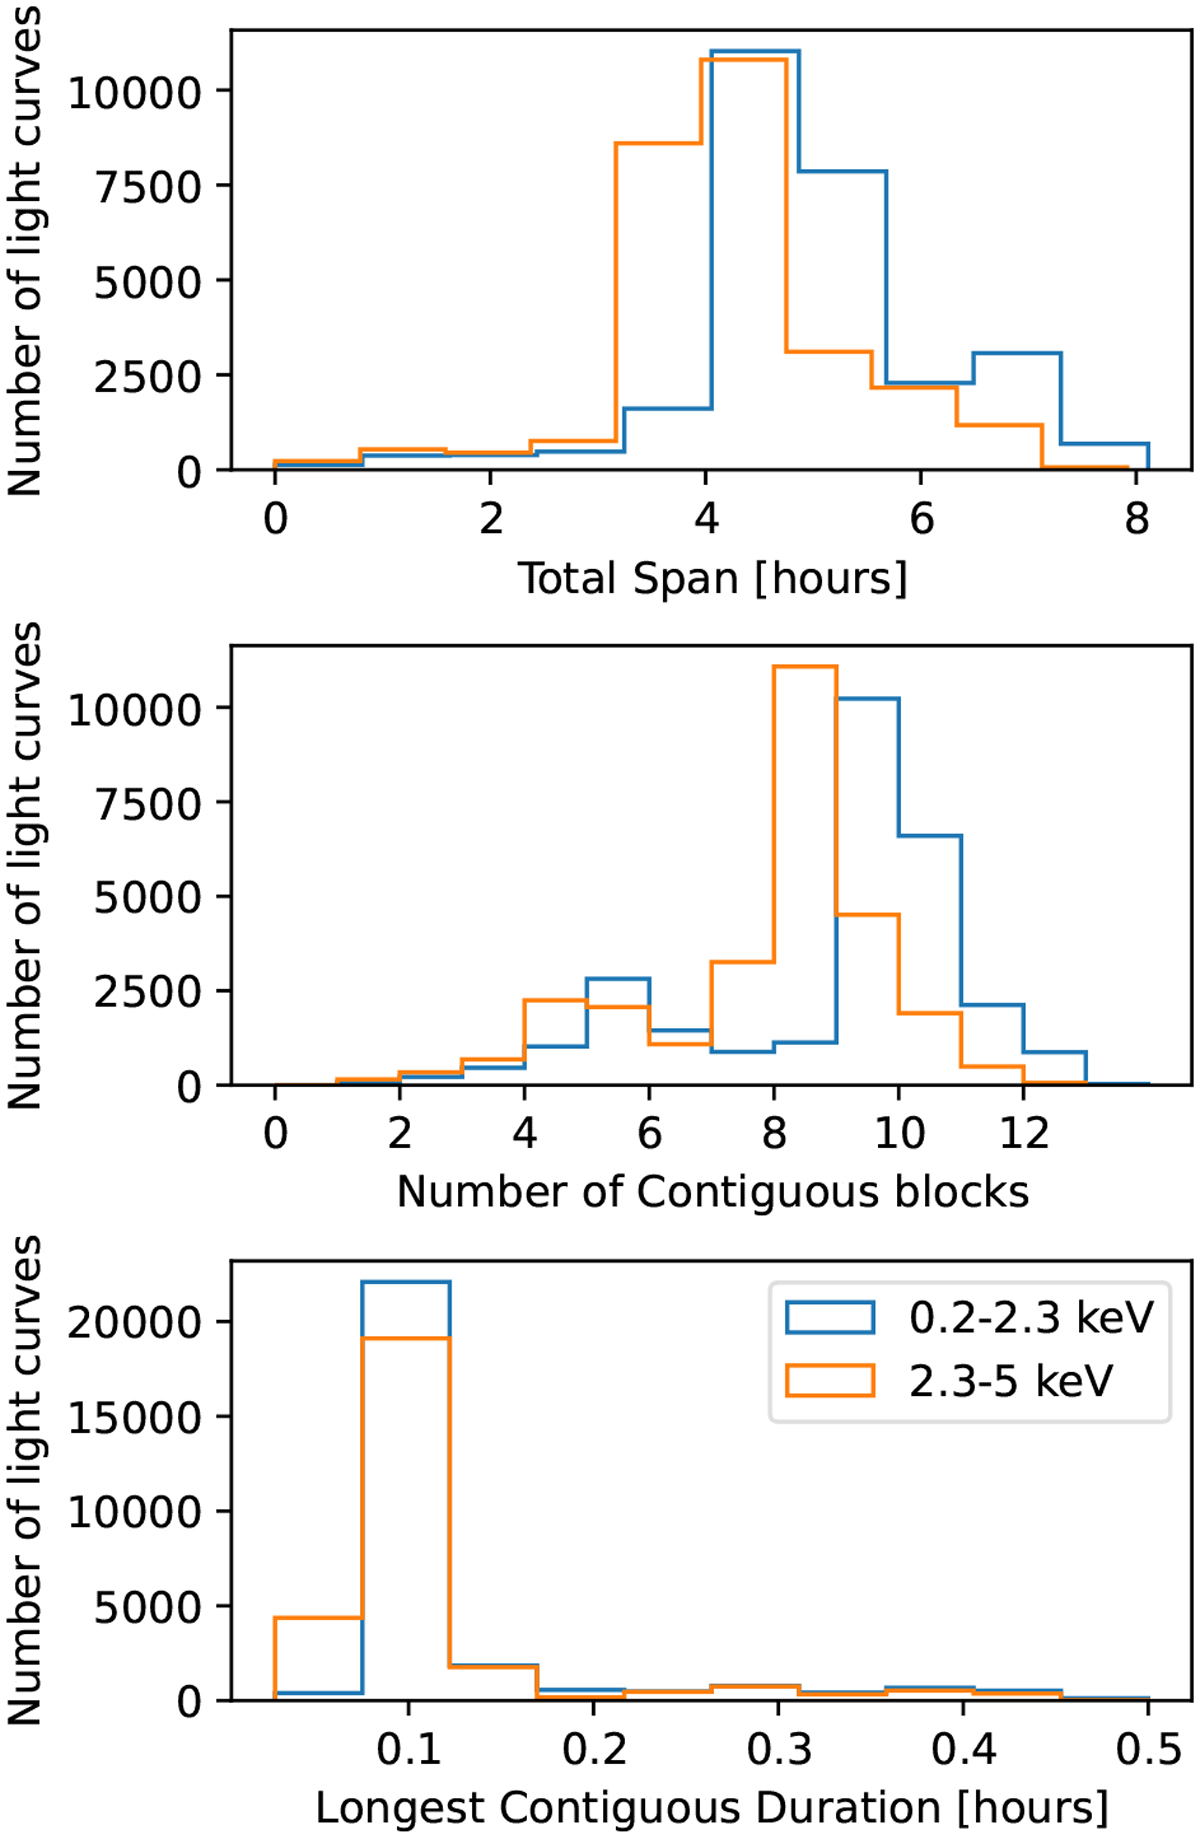
Fig. 3
Download original image
Light-curve cadence summary statistics. Top panel: the time between first and last exposed time bins for each light curve, with typical values of four to seven hours. As Fig. 1 illustrates, the light curves are segmented into blocks. Middle panel: number of blocks, which ranges from 4 to 12. Bottom panel: duration of the longest block for each light curve, which typically lasts only a few minutes.
Current usage metrics show cumulative count of Article Views (full-text article views including HTML views, PDF and ePub downloads, according to the available data) and Abstracts Views on Vision4Press platform.
Data correspond to usage on the plateform after 2015. The current usage metrics is available 48-96 hours after online publication and is updated daily on week days.
Initial download of the metrics may take a while.