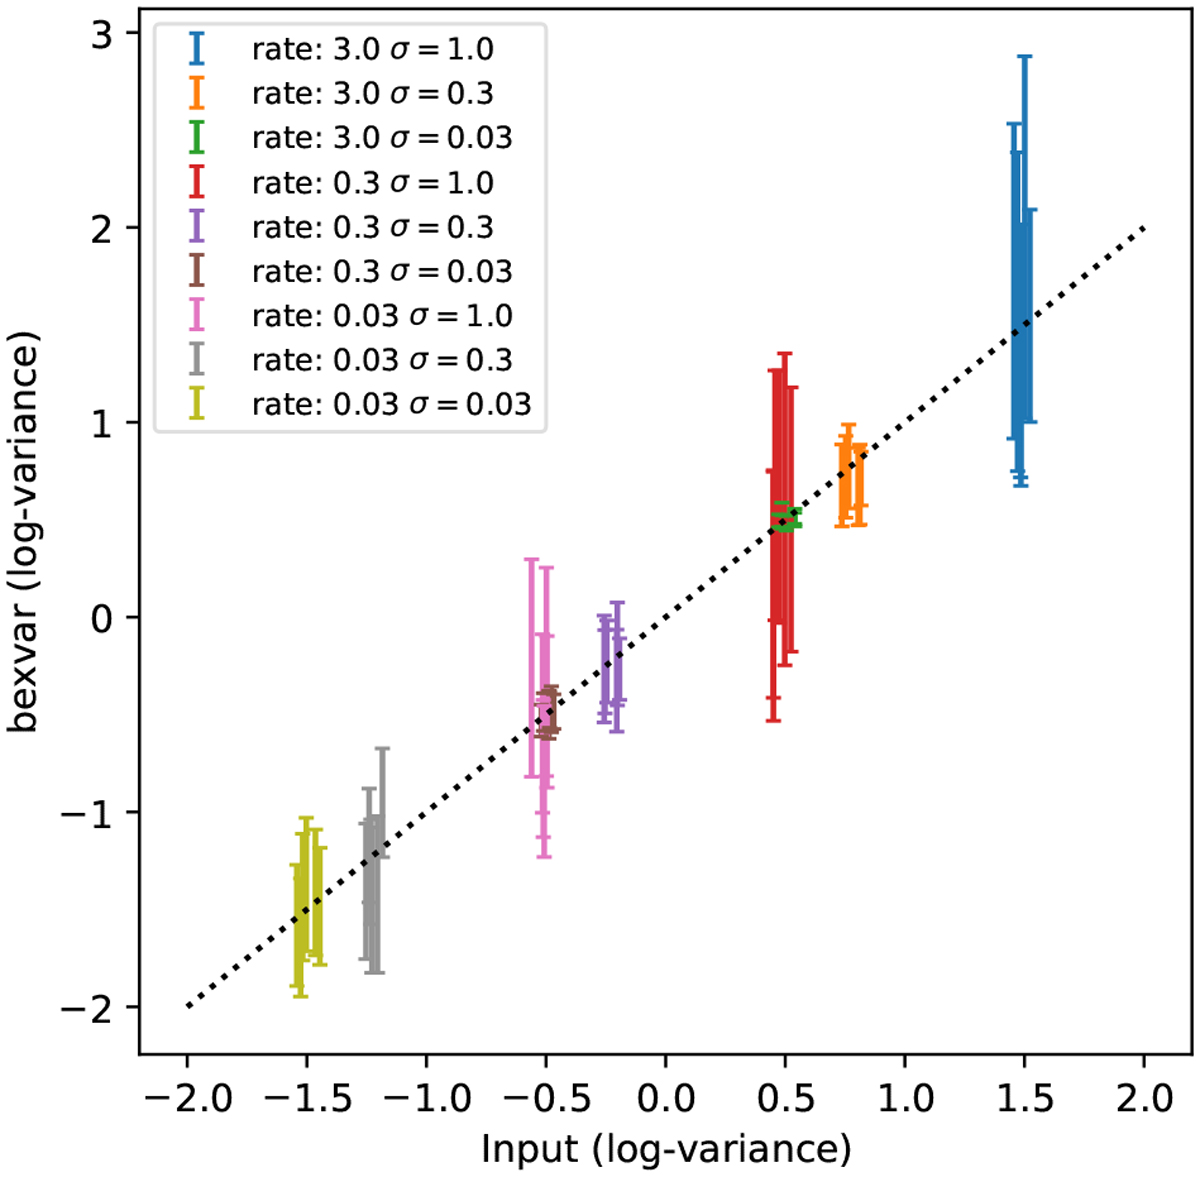
Fig. A.1
Download original image
Inferred Bayesian excess variance for various simulated variances and count rates. Error bars indicate the 95% credible interval for an arbitrary subset of the simulations. A small displacement in the x-axis is added to each data point for clarity. The dotted line indicates the 1:1 correspondence.
Current usage metrics show cumulative count of Article Views (full-text article views including HTML views, PDF and ePub downloads, according to the available data) and Abstracts Views on Vision4Press platform.
Data correspond to usage on the plateform after 2015. The current usage metrics is available 48-96 hours after online publication and is updated daily on week days.
Initial download of the metrics may take a while.