Fig. 13
Download original image
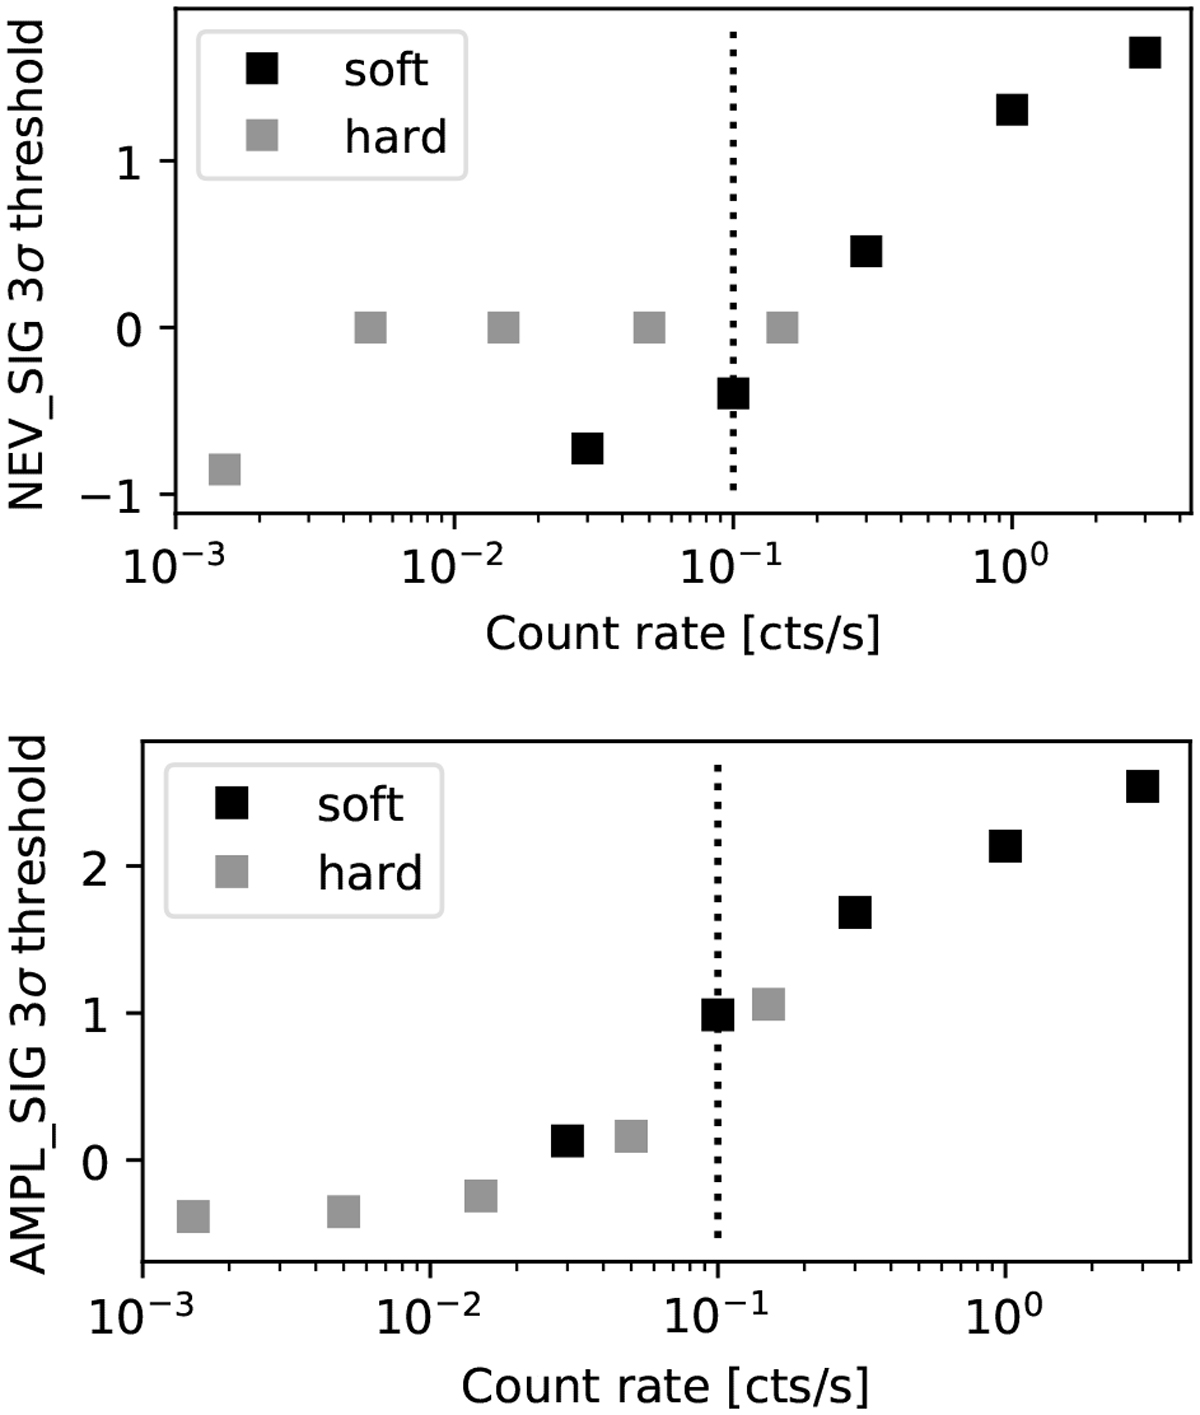
Calibrated thresholds as a function of count rate. Points show the 3σ extreme for each simulation, for excess variance (top), amplitude maximum deviation (middle panel), and Bayesian excess variance (bottom panel). The vertical dotted line indicates the typical uncertainty on ṜS.
Current usage metrics show cumulative count of Article Views (full-text article views including HTML views, PDF and ePub downloads, according to the available data) and Abstracts Views on Vision4Press platform.
Data correspond to usage on the plateform after 2015. The current usage metrics is available 48-96 hours after online publication and is updated daily on week days.
Initial download of the metrics may take a while.