Fig. 11
Download original image
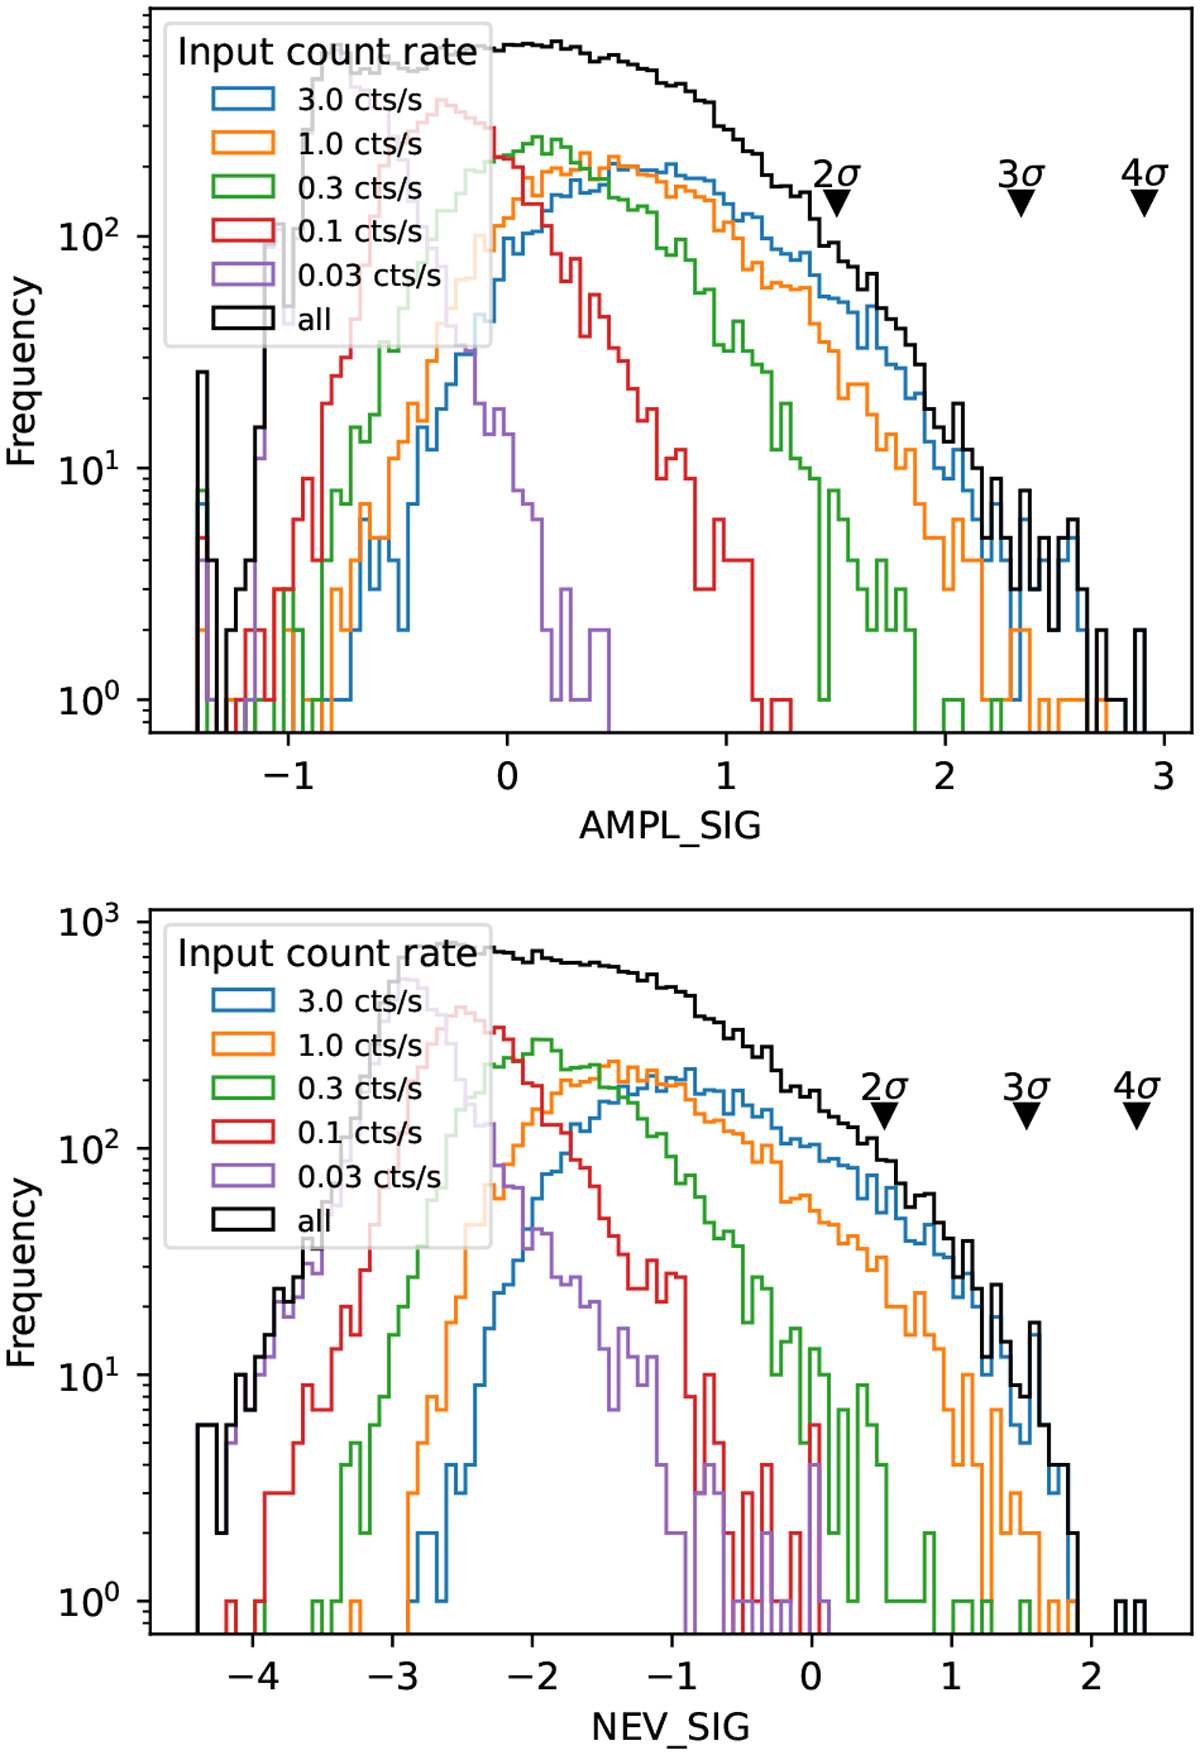
Estimator distribution for simulated constant light curves. Top panel: amplitude maximum deviation significance (Eq. (9)). Bottom panel: significance of the excess variance and variability fraction (Eq. (16)). Each coloured histogram represents a set of simulations with the indicated constant input count rate. For the full data set (black histogram), black downward triangles point to the 2, 3, and 4σ equivalent quantiles of the distribution.
Current usage metrics show cumulative count of Article Views (full-text article views including HTML views, PDF and ePub downloads, according to the available data) and Abstracts Views on Vision4Press platform.
Data correspond to usage on the plateform after 2015. The current usage metrics is available 48-96 hours after online publication and is updated daily on week days.
Initial download of the metrics may take a while.