Fig. 1
Download original image
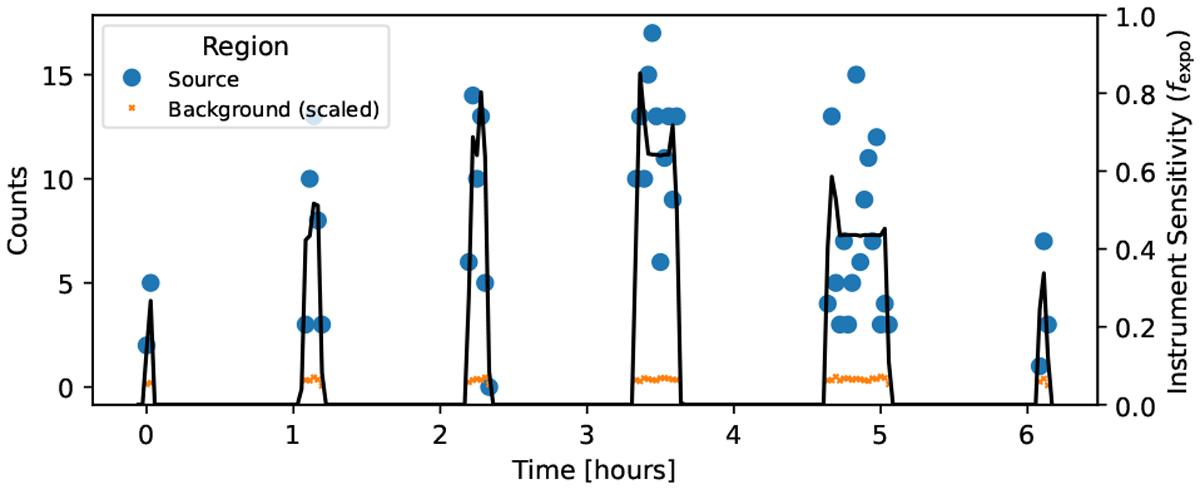
Example counts of the tenth brightest eFEDS source. The markers indicate the number of counts from a single eROSITA telescope module in 100s time bins, recorded over a six-hour period. The black curve shows the sensitivity to the source position over time.
Current usage metrics show cumulative count of Article Views (full-text article views including HTML views, PDF and ePub downloads, according to the available data) and Abstracts Views on Vision4Press platform.
Data correspond to usage on the plateform after 2015. The current usage metrics is available 48-96 hours after online publication and is updated daily on week days.
Initial download of the metrics may take a while.