Fig. A.1
Download original image
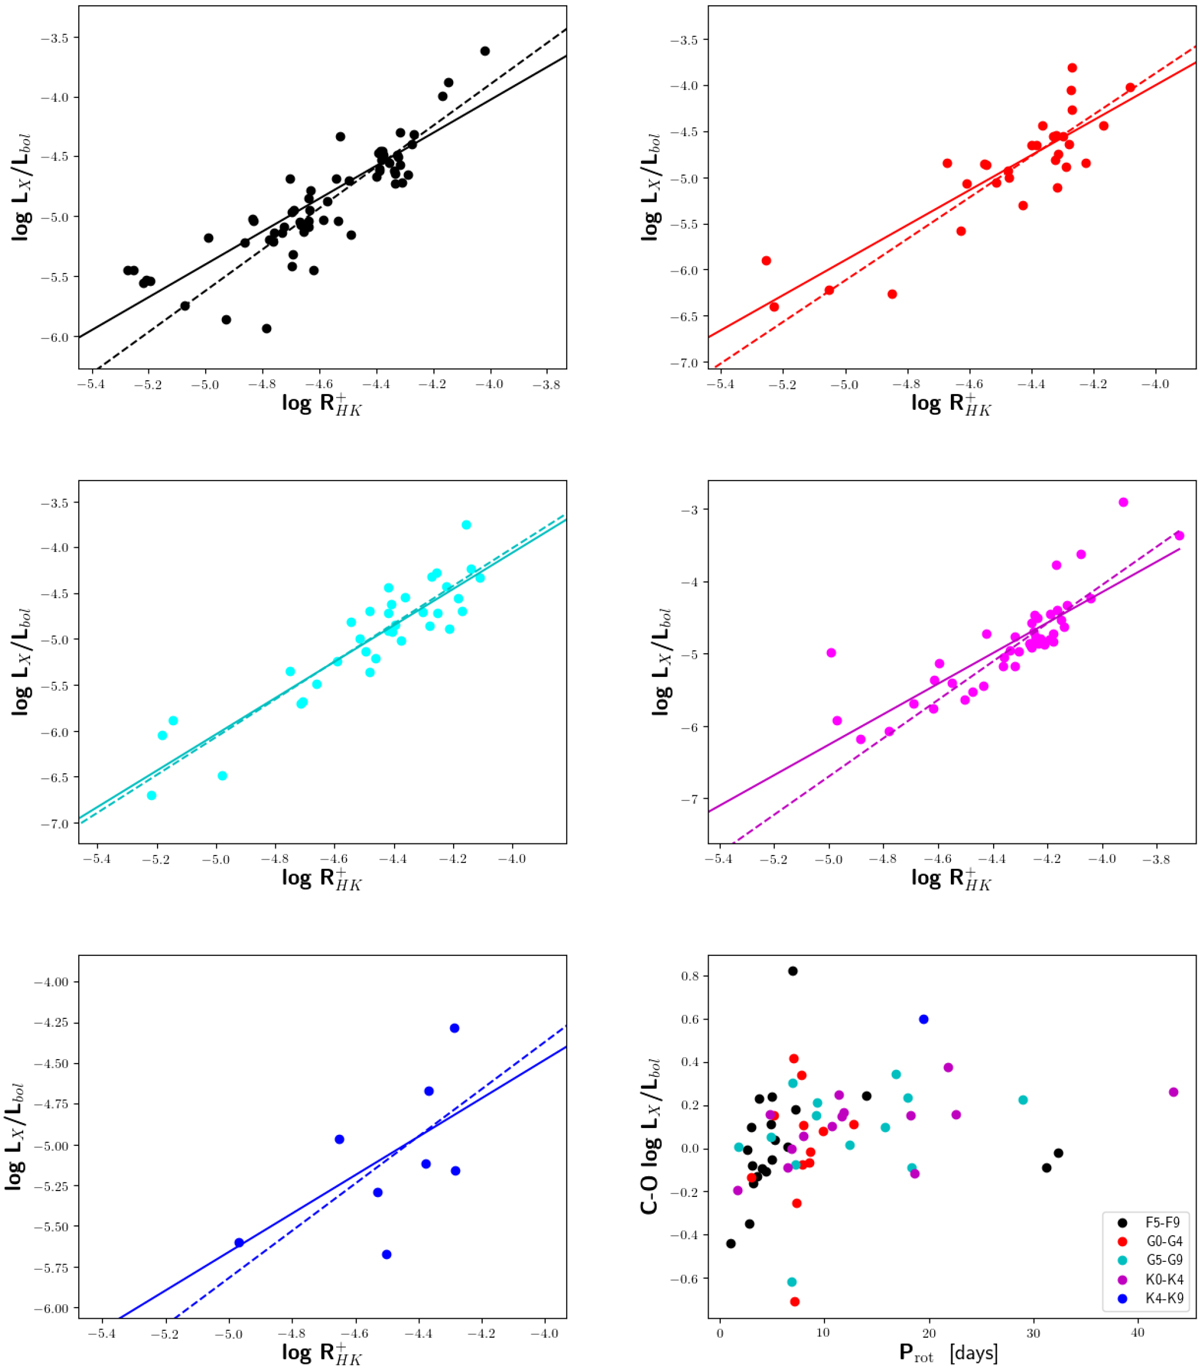
Same as Fig. 8, but for every spectral type group separately. The solid lines mark the linear regression taking all stars into account, andthe dashed lines mark the linear regression with only the more active stars with ![]() . In the bottom right corner, we show the same as in Fig. 7, but for the fits of the different spectral groups marked in their respective colour.
. In the bottom right corner, we show the same as in Fig. 7, but for the fits of the different spectral groups marked in their respective colour.
Current usage metrics show cumulative count of Article Views (full-text article views including HTML views, PDF and ePub downloads, according to the available data) and Abstracts Views on Vision4Press platform.
Data correspond to usage on the plateform after 2015. The current usage metrics is available 48-96 hours after online publication and is updated daily on week days.
Initial download of the metrics may take a while.