Fig. 5
Download original image
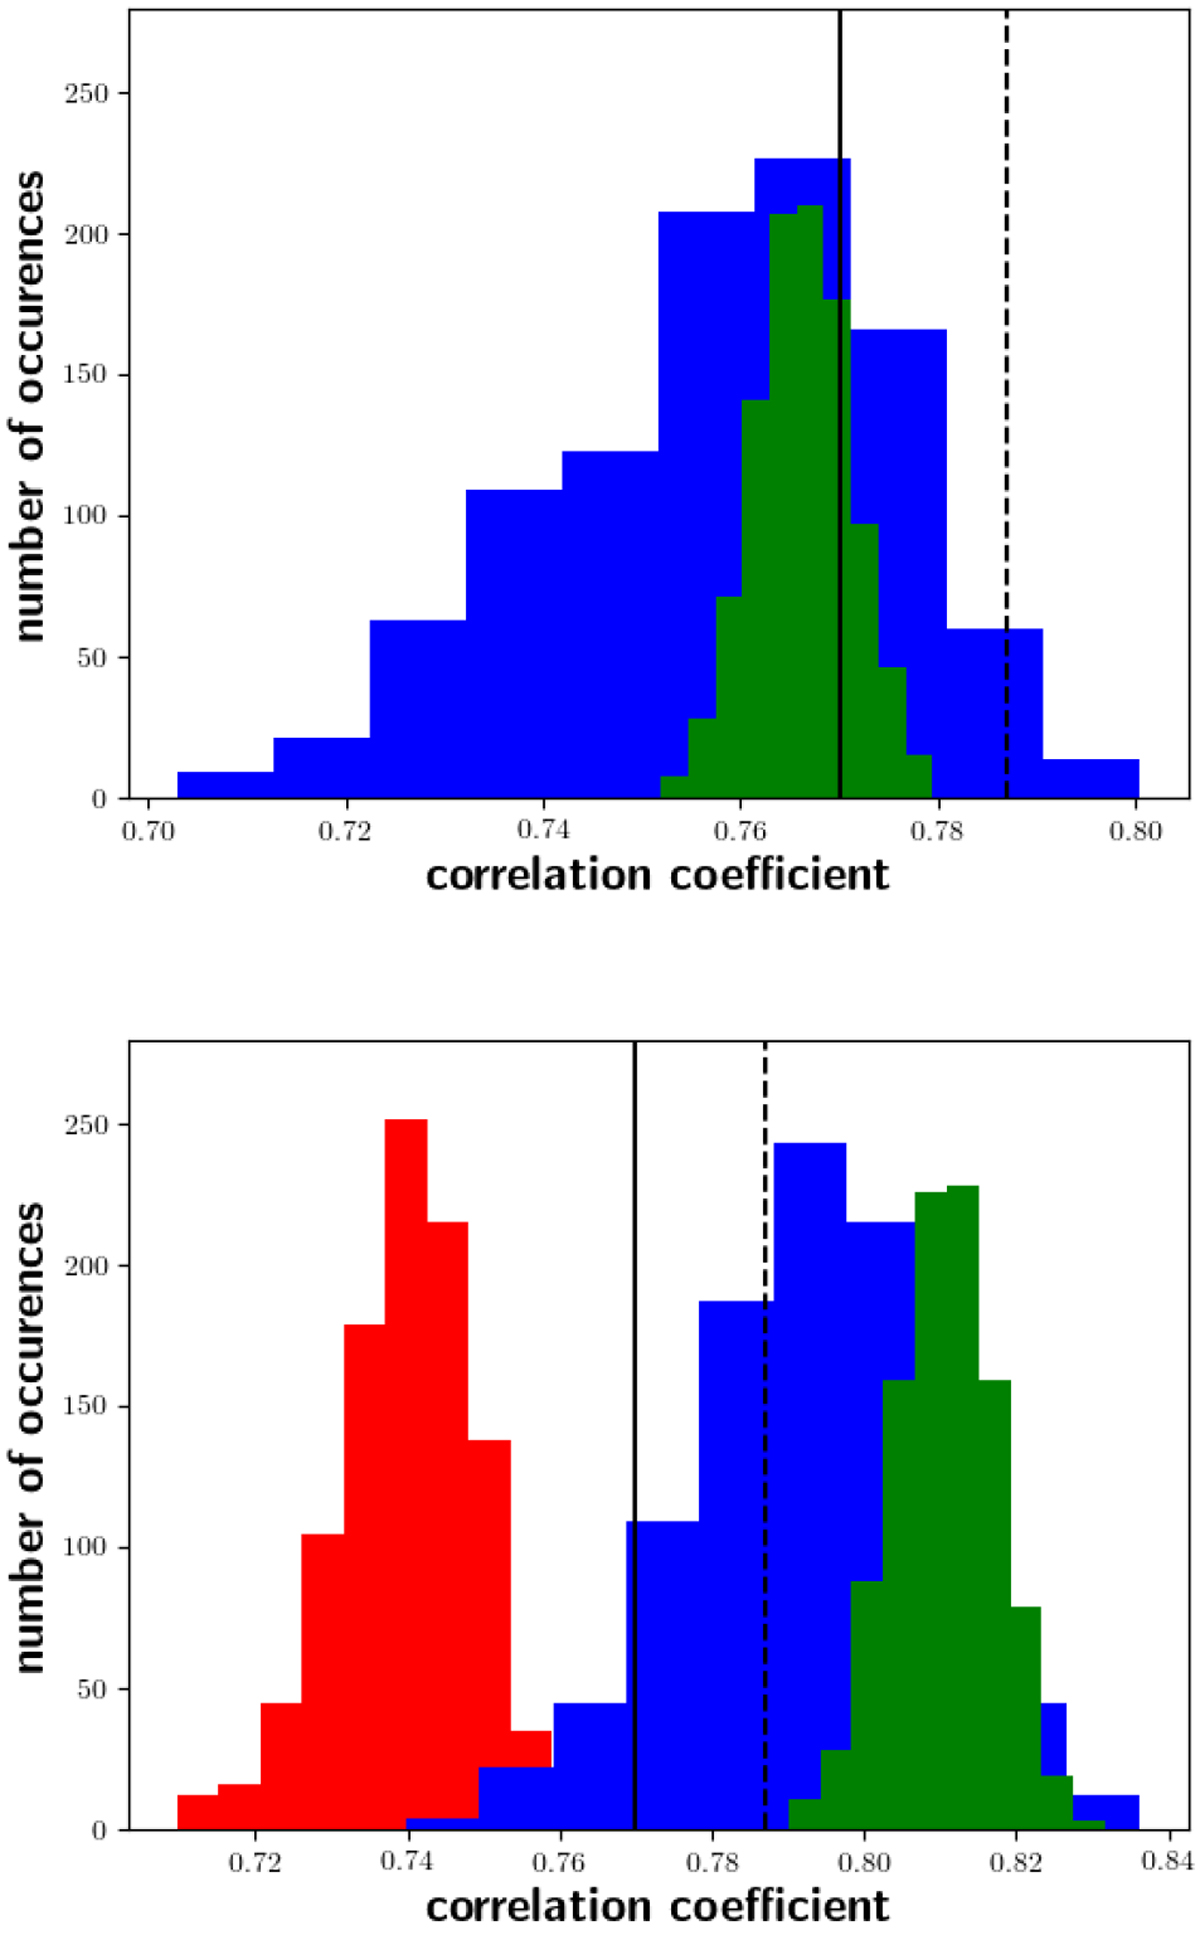
Correlation coefficients derived by choosing ![]() values from different spectra of the individual star and computing the correlation of
values from different spectra of the individual star and computing the correlation of ![]() to log(LX/Lbol) for all stars 1000 times. Top: considering the valid sample and all available TIGRE spectra (blue), or only the pseudo-simultaneous data (green). Bottom: same as above, but for the 88 stars with TIGRE data older than 750 days before the start of the eROSITA observations. Choosing data only from these old data leads to a poorer correlation (red). For both panels, the vertical dashed black line represents the correlation coefficient obtained with the median value of
to log(LX/Lbol) for all stars 1000 times. Top: considering the valid sample and all available TIGRE spectra (blue), or only the pseudo-simultaneous data (green). Bottom: same as above, but for the 88 stars with TIGRE data older than 750 days before the start of the eROSITA observations. Choosing data only from these old data leads to a poorer correlation (red). For both panels, the vertical dashed black line represents the correlation coefficient obtained with the median value of ![]() of all available data for the valid sample. The vertical solid black line represents the same using pseudo-simultaneous data.
of all available data for the valid sample. The vertical solid black line represents the same using pseudo-simultaneous data.
Current usage metrics show cumulative count of Article Views (full-text article views including HTML views, PDF and ePub downloads, according to the available data) and Abstracts Views on Vision4Press platform.
Data correspond to usage on the plateform after 2015. The current usage metrics is available 48-96 hours after online publication and is updated daily on week days.
Initial download of the metrics may take a while.