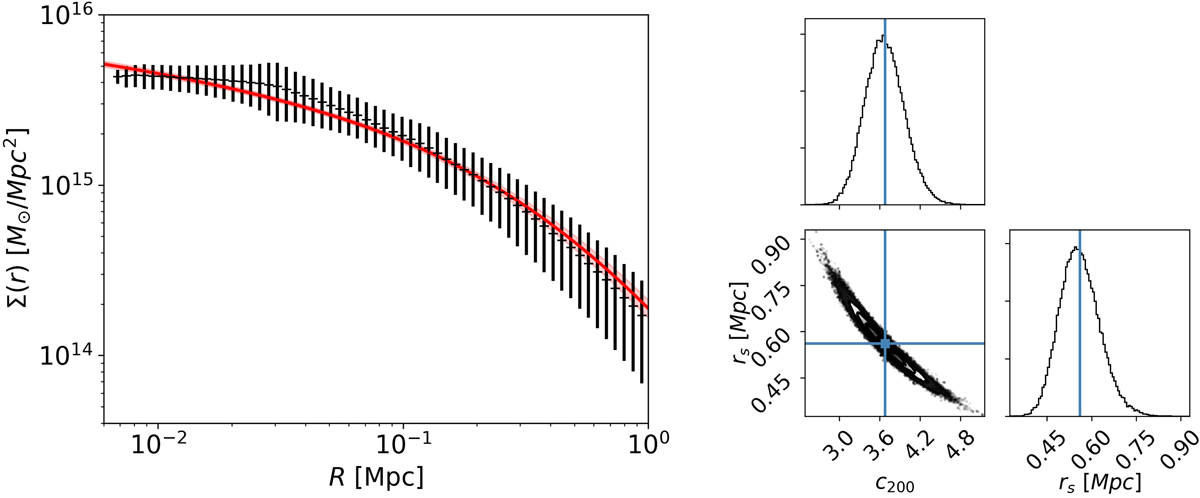
Fig. 4.
Download original image
Lensing analysis. Left: projected lensing mass density profile as a function of radius from the PIEMD+eNFW κ-map Zitrin et al. (2015) lens model (black points). Also shown are our best-fit projected NFW profile and 1σ uncertainties (red line and shaded area). The 2D sky angular separation from the cluster center has been converted to radial distance (in Mpc) using the angular distance at the cluster redshift. Right: 2D and 1D posterior probability distributions for the c200 and rs parameters of the 3D mass profile as obtained from the MCMC analysis.
Current usage metrics show cumulative count of Article Views (full-text article views including HTML views, PDF and ePub downloads, according to the available data) and Abstracts Views on Vision4Press platform.
Data correspond to usage on the plateform after 2015. The current usage metrics is available 48-96 hours after online publication and is updated daily on week days.
Initial download of the metrics may take a while.