Fig. 3.
Download original image
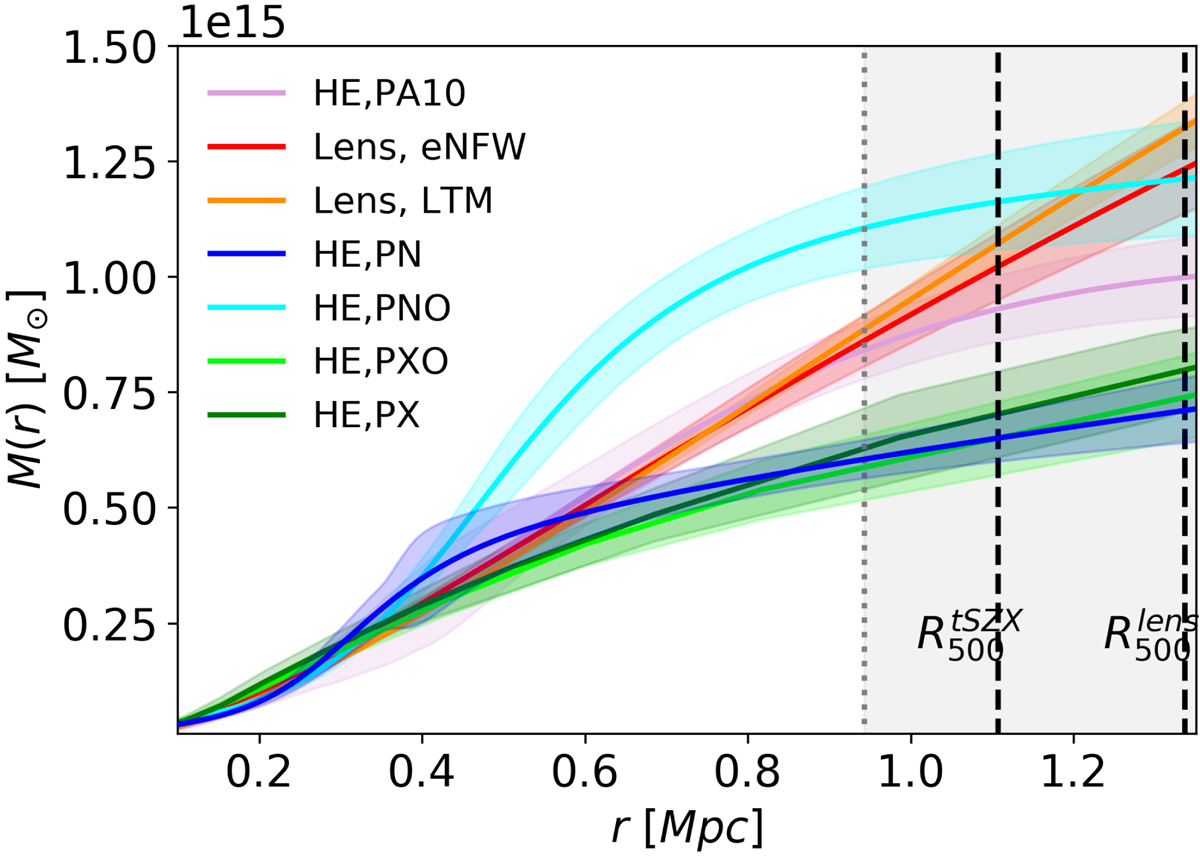
Combined X-ray and tSZ hydrostatic mass profile computed using three different electron pressure estimates: (1) non-parametric fit using the full 150 GHz NIKA2 map (HE over-pressure, PNO, cyan), (2) non-parametric fit masking the over-pressure region (HE, PN, blue), and (3) the universal Arnaud et al. (2010) pressure profile for this cluster (pink, PA10). Also shown are reconstructed X-ray-only hydrostatic mass profiles, excluding (PX, dark green) and including over-pressure (PXO, bright green), as well as a reconstructed lensing mass profile for the eNFW (red) and LTM models (orange). The vertical dotted line represents the maximum radius at which the lensing data are available. The dashed lines show the characteristic radii ![]() and
and ![]() (see text for details).
(see text for details).
Current usage metrics show cumulative count of Article Views (full-text article views including HTML views, PDF and ePub downloads, according to the available data) and Abstracts Views on Vision4Press platform.
Data correspond to usage on the plateform after 2015. The current usage metrics is available 48-96 hours after online publication and is updated daily on week days.
Initial download of the metrics may take a while.