Fig. 2.
Download original image
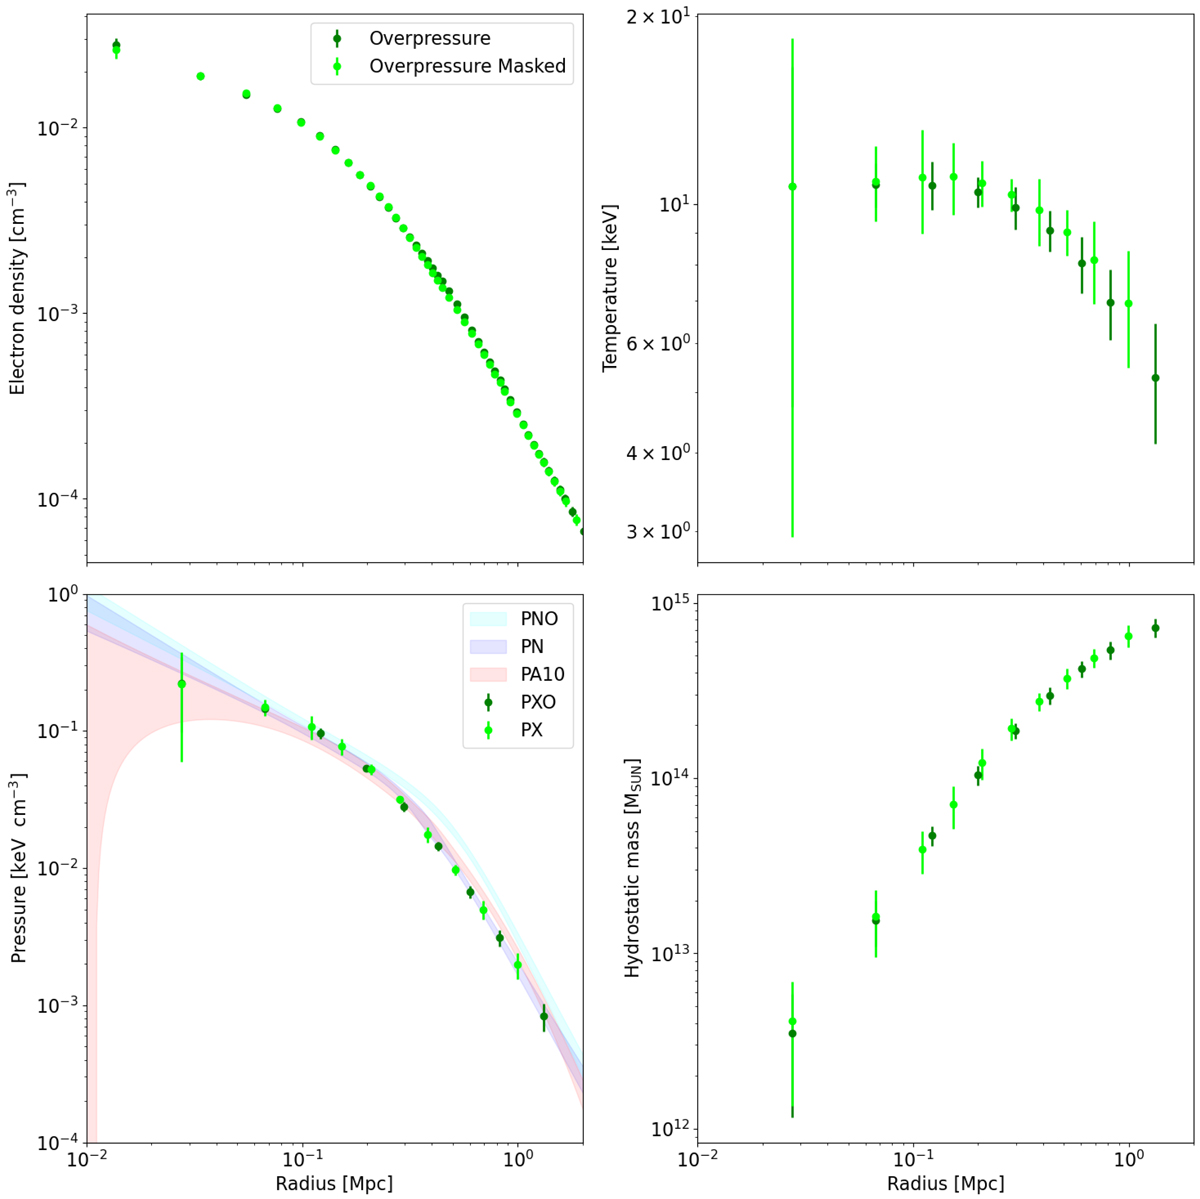
Electron density, temperature, pressure, and hydrostatic mass profiles as derived from the XMM-Newton X-ray data. The dark and light green dots represent the profile computed using the full cluster emission and masking the over-pressure area, respectively. We also show for comparison the PN, PNO, and PA10 pressure profiles presented in Fig. 1.
Current usage metrics show cumulative count of Article Views (full-text article views including HTML views, PDF and ePub downloads, according to the available data) and Abstracts Views on Vision4Press platform.
Data correspond to usage on the plateform after 2015. The current usage metrics is available 48-96 hours after online publication and is updated daily on week days.
Initial download of the metrics may take a while.