Fig. 1.
Download original image
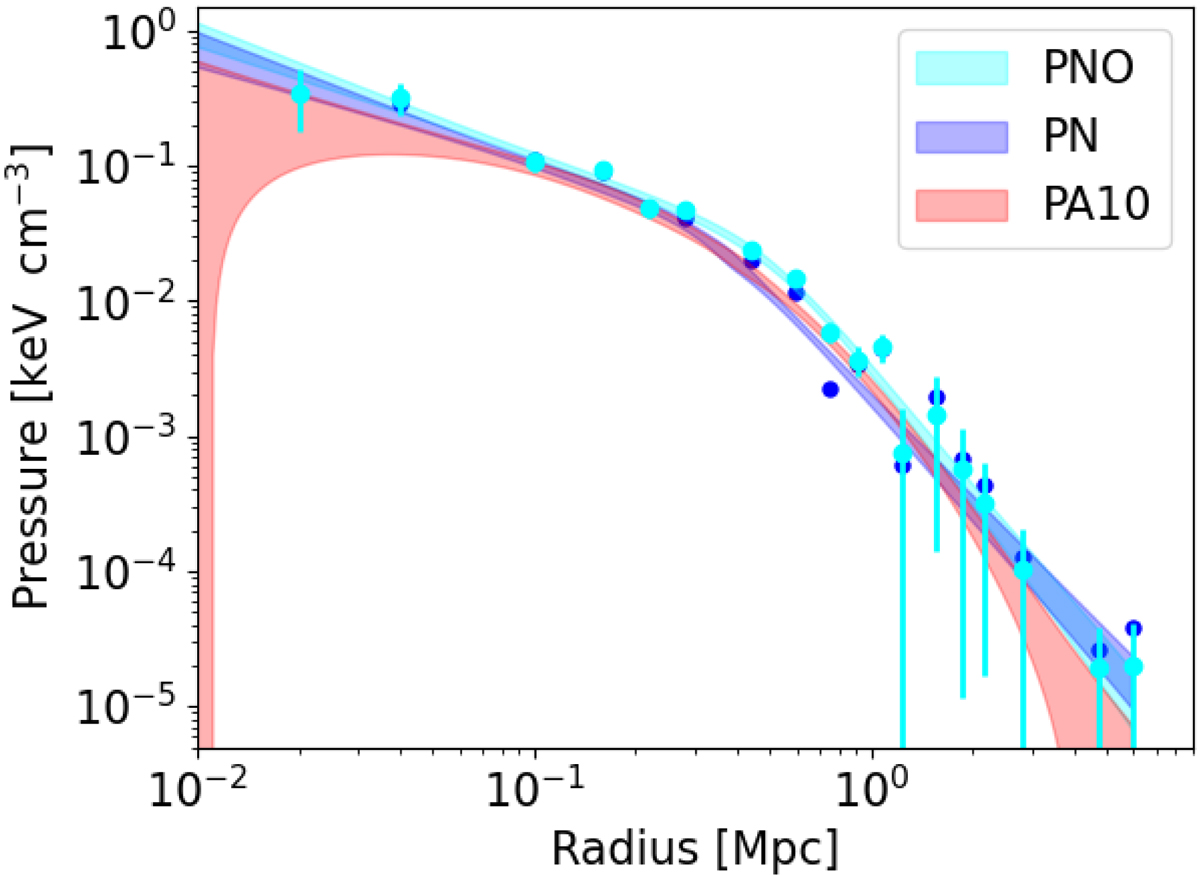
Pressure profiles derived from the full 150 GHz map (cyan, PNO, cyan) and excluding the over-pressure region (PN, blue). The dots and error bars correspond to the non-parametric fit to the SZ. The shadow region represents the best-fit gNFW model to the non-parametric pressure profiles. We also show in red the universal pressure profile (Arnaud et al. 2010) for the cluster (PA10).
Current usage metrics show cumulative count of Article Views (full-text article views including HTML views, PDF and ePub downloads, according to the available data) and Abstracts Views on Vision4Press platform.
Data correspond to usage on the plateform after 2015. The current usage metrics is available 48-96 hours after online publication and is updated daily on week days.
Initial download of the metrics may take a while.