| Issue |
A&A
Volume 660, April 2022
|
|
|---|---|---|
| Article Number | A32 | |
| Number of page(s) | 9 | |
| Section | Extragalactic astronomy | |
| DOI | https://doi.org/10.1051/0004-6361/202143024 | |
| Published online | 05 April 2022 | |
Detection of a radio-filled X-ray cavity within the interstellar medium of NGC 5141
1
Dipartimento di Fisica e Astronomia, Alma Mater Studiorum, Università degli Studi di Bologna, Via Gobetti 93/2, 40129 Bologna, Italy
e-mail: This email address is being protected from spambots. You need JavaScript enabled to view it.
2
INAF-Osservatorio di Astrofisica e Scienza dello Spazio di Bologna (OAS), Area della Ricerca CNR, Via Gobetti 101, 40129 Bologna, Italy
3
INAF, Istituto di Radioastronomia di Bologna (IRA), Via Gobetti 101, 40129 Bologna, Italy
4
University of California Observatories/Lick Observatory, Department of Astronomy and Astrophysics, University of California, Santa Cruz, CA 95064, USA
Received:
31
December
2021
Accepted:
28
January
2022
Abstract
We present the first Chandra detection of a single X-ray cavity within the interstellar medium of the small Fanaroff-Riley type I radio galaxy NGC 5141. The X-ray surface brightness depression, located ≈4 kpc away from the galaxy center, is projected on the northern radio lobe, which is completely contained within the galaxy. The thermal gas surrounding the cavity, which extends to ≃20 kpc, has a bolometric X-ray luminosity (0.1–100 keV) of LX ≈ 2 × 1040 erg s−1 and a temperature of kT ≈ 0.8 keV. We calculated the total energy (Ecav = 4PV ≈ 1055 erg) required to inflate the cavity and its age (tcav ≈ 9 Myrs), assuming that it is filled with relativistic particles and rises buoyantly. The inferred total cavity power is as low as Pcav = Ecav/tcav ≈ 6 × 1040 erg s−1, which is the lowest one among the radio-filled systems. Comparing Pcav to the bolometric X-ray luminosity (i.e., the cooling luminosity), we conclude that NGC 5141’s central active galactic nucleus can heat the interstellar medium and balance its cooling luminosity, confirming that the Pcav − Lcool relation, mainly tested on groups and clusters, also works for such a low-power system.
Key words: galaxies: individual: NGC 5141 / galaxies: active / galaxies: elliptical and lenticular, cD / galaxies: ISM / galaxies: jets / X-rays: ISM
© ESO 2022
1. Introduction
Over the years, it has become clear that active galactic nuclei (AGN) coevolve with their host galaxies (see e.g., Magorrian et al. 1998; Gebhardt et al. 2000; Ferrarese & Merritt 2000; Tremaine et al. 2002; Greene & Ho 2006). The energy emitted by an AGN can heat up and/or remove the cold gas reservoir present in the host galaxy’s interstellar medium (ISM), and therefore effectively halt the formation of new stars. Two kinds of AGN feedback are known: the radiative one, which occurs when the central black hole accretes near the Eddington limit (also known as quasar or wind mode), and the radio mode, which occurs when the AGN has powerful jets interacting with a hot dense halo (also named the kinetic mode, see, e.g., Fabian 2012 for a review).
The feedback from AGN is also invoked as a natural solution to the cooling problem in clusters (see e.g., McNamara & Nulsen 2007, 2012; Fabian 2012). The classical cooling flow model (Fabian 1994) predicted cooling times of the gas in the cluster core shorter than 1 Gyr, implying strong accretion onto the central galaxies (from hundreds to thousands of solar masses per year) and large star formation (Bîrzan et al. 2004). This was not confirmed by the Chandra and XMM-Newton observations (see, e.g., Makishima et al. 2001; Tamura et al. 2001); X-ray studies showed that in many cases, AGN are energetically able to balance radiative losses from the intracluster medium (ICM) (Rafferty et al. 2006) and that a significant fraction of the energy of the radio lobes, powered by AGN, is dissipated within the cooling flow region (Churazov et al. 2002). These results indicated that the dissipation of energy, propagating through the ICM from a central radio source, can balance radiative cooling (Peterson & Fabian 2006). The radio mode AGN feedback signature consists of a surface brightness depression in the hot surrounding gas (ICM; intragroup medium, IGM; or ISM), excavated by the jet during its propagation. These cavities constitute a fundamental (and direct) tool to estimate the jet’s kinetic power and explore the feedback, simply comparing the jet heating with the cooling of the surrounding hot gas. At first, X-ray cavities were found in clusters (e.g., Boehringer et al. 1993; Carilli et al. 1994), then also in small groups and isolated galaxies. However, clusters remain the environment where the vast majority of X-ray cavities are found by far because of their high X-ray surface brightness. Conversely, X-ray cavities in isolated galaxies are the most elusive and they are essentially confined to giant elliptical galaxies (see e.g., Bîrzan et al. 2004, 2020; Nulsen et al. 2007; Cavagnolo et al. 2010). Here we report the robust case of a non-giant galaxy (NGC 5141) hosting an X-ray cavity in its hot atmosphere.
The X-ray cavity detection within NGC 5141 is particularly interesting because of the following: (i) NGC 5141 hosts a known small radio galaxy, whose emission is spatially contained within the optical galaxy; (ii) it enables us to test the heating versus cooling AGN feedback scaling relation to the lowest end of radio galaxies power and size; (iii) the galaxy has a lenticular or elliptical uncertain classification and (to the best of our knowledge) would be the third S0 with detected cavities in the literature after NGC 4477 (Li et al. 2018) and NGC 193 (Bogdán et al. 2014); and (iv) NGC 5141 shows signs of an interaction with a galaxy companion ≈50 kpc away.
Throughout the paper the cosmological parameters adopted are as follows: H0 = 70 km s−1 Mpc−1, ΛΩ = 0.73, and Λm = 0.27 (in agreement with the Planck 2015 Results, see Planck Collaboration XIII 2016). With the adopted cosmology, 1″ ≈ 0.353 kpc at the redshift of the galaxy (z = 0.017381).
2. The source
NGC 5141 (a.k.a. UGC 08433) is a local source (z = 0.01738), which is part of a small group of six galaxies (Ramella et al. 1989). It forms a dual galaxy system with NGC 5142, which is located 2.3′ to the northeast (≈50 kpc, see Fig. 1-left panel; Soares 1989). It is a clear example of an interacting galaxy, as suggested by its nonelliptical isophotes (Gonzalez-Serrano et al. 1993). Its disturbed morphology is probably the cause of a controversial classification. It was classified as lenticular (Nilson 1973; Condon & Broderick 1988), spiral-barred (Courteau et al. 2003), and as elliptical galaxy (Calvani et al. 1989; Véron-Cetty & Véron 2001; Pagotto et al. 2017). Willett et al. (2013) classified the source as a smooth round galaxy with no disk and peculiar features. Huertas-Company et al. (2011), who performed a Bayesian automated classification of galaxies within the Sloan Digital Sky Survey (SDSS DR7), quantified the classification as uncertain, indicating a probability of 65% and of 32% that NGC 5141 is an elliptical and an S0, respectively. Signs of an interaction between NGC 5141 and its companion were also provided by Emonts et al. (2010). They found two clouds of resolved HI emission of ∼6.9 × 10⁷ M⊙ at a distance of 20 kpc from the center of NGC 5141 in the companion direction (NGC 5142), interpreted as a bridge-tail structure. HI absorption was also observed on the radio continuum of the radio galaxy. The absorbing gas is slightly extended in the same direction as the emission clouds, and it is probably part of the same large-scale gas structure. NGC 5141 was studied by Ocaña Flaquer et al. (2010) for its molecular gas emission lines (CO): they calculated an upper limit on the molecular gas within NGC 5141 of MH2 < 5 × 10⁸ M⊙.
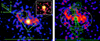 |
Fig. 1. NGC 5141 X-ray image in the 0.5–7.0 keV band using a logarithmic scale with σ = 2 pixels of Gaussian smoothing and a scale parameter value ≥0.035 counts per pixel. Left panel: three main X-ray features can be identified: (i) the nuclear region; (ii) an extended diffuse gas emission (cavity rims and western blob); and (iii) a cavity (dashed yellow circle). A zoom of the nonsmoothed nuclear region is shown in the top-right white panel: the core (iv) and the southern jet (v) are clearly visible. The green arrow points to the NGC 5142 optical center. Right panel: optical (dashed white) and radio VLA at 1.4 GHz (green; resolution = 1.4″, RMS = 0.1 mJy beam−1) contours overlap with the X-ray image, after having removed the nuclear emission (2″ × 4″ ellipse, see Sect. 3.2). The cavity position is indicated by the dashed yellow circle. The optical contours are taken from SDSS g-band emission within 70% of the NGC 5141 emitted light. The radio green contours are at −9, 9, 18, 36, 72, 144 × RMS; the image is taken from the NRAO Science Data Archive. |
Being part of the GALEX-SDSS-WISE legacy, the host properties of NGC 5141 are well studied (Salim et al. 2016, 2018). Classified as a low excitation radio galaxy (hereafter LERG) by Best & Heckman (2012) based on its narrow-line region emission line ratios, NGC 5141 hides an inefficient accretion flow powered by a black hole mass of MBH = (4 ± 2)×108 M⊙, as estimated from its H-band magnitude, following the correlation by Marconi & Hunt (2003).
NGC 5141 has a stellar mass of  M⊙ and a star formation rate of log(SFR) = − 0.529 ± 0.054 M⊙ yr−1, which are both typical of an early-type galaxy (Salim et al. 2016, 2018). The age of NGC 5141 is tsys ≥ 12 Gyrs as calculated by Maraston (2005) and Maraston et al. (2009)2. In the central region, an Hubble space telescope (HST) study indicates the presence of a central dust lane with a size of ≈2″ along the galactic plane (Verdoes Kleijn et al. 1999; van Bemmel et al. 2012).
NGC 5141 was identified with the radio galaxy 4C +36.24 by Caswell & Wills (1967) and classified as a twin-jet Fanaroff-Riley type I (FRI) by Owen & Laing (1989). It is also part of the FRI catalog (FRIcat; Capetti et al. 2017), which was built by cross-correlating the seventh data release of the SDSS with the NRAO (National Radio Astronomy Observatory) VLA (Very Large Array) Sky Survey (NVSS), and the Faint Images of the Radio Sky at Twenty centimeters (FIRST). Its radio emission, which is totally confined within the host galaxy, has an extension of only ≈19 kpc (Emonts et al. 2010). The total flux density at 1.4 GHz is S = 880 ± 30 mJy (Condon et al. 1998), which corresponds to a luminosity3 of L(1.4 GHz) = (8.2 ± 0.3)×1039 erg s−1. 4C +36.24 is a radiatively young source, as shown by Parma et al. (1999): in the 1.4-5 GHz spectral range, the source did not reveal any significant spectral slope change between the core and lobes, with a maximum spectral index value of αmax = −0.75. They estimated a lower limit on the spectral break frequency (νbr > 30 GHz), using the synchrotron-loss spectrum for the Jaffe & Perola model (Jaffe & Perola 1973). Thus, they provided a radiative age upper limit of tage < 4 Myrs. At milliarcsecond resolution, Giovannini et al. (2001) observed a one-sided jet in the same direction of the main large-scale jet and estimated an upper limit on the jet inclination angle of θ ≤ 58°.
In the X-ray band, a single Chandra observation of this source (November 25, 2003, ObsID 4055) is available. It was analyzed by Kharb et al. (2012), who focused on NGC 5141 nuclear spectral analysis and found slightly extended emission (≈4″) associated with the southern radio jet. In this work, we analyze the same X-ray observation. Our main goal is to study extended emission from NGC 5141 and the jet-ISM interaction.
3. X-ray data analysis
We analyzed the 31 ksec Chandra ACIS-S observation of NGC 5141 available in the public archive. Chandra data were reprocessed following standard procedures using the software CIAO 4.11 with CALDB 4.8.1. Good time intervals were defined by using the light curve to filter out times of background flares from the event file. The net exposure time was 26.8 ksec. In the 0.5–7 keV image, the most interesting feature is the northern X-ray cavity (Fig. 1-left panel). If VLA radio contours at 1.4 GHz (taken from the NRAO public archive4) are superimposed on the smoothed X-ray image, the X-ray cavity position corresponds to the northern radio lobe (see Fig. 1-right panel). In the southern hemisphere, X-ray emission is generally lacking on the galactic scale. Only the nucleus is slightly elongated to the south because of the southern jet emission.
For all the spectral analysis, the background was selected as an annular region with inner and outer radii of 50″ and 70″, respectively, within the same CCD as the source but far away from the NGC 5141 X-ray structures (see Fig. 2). Point-like sources falling into the background region were removed. The X-ray spectral analysis was performed with XSPEC12.11.1 (Arnaud 1996) in the 0.5–7 keV energy band. The data were rebinned to have at least two counts per bin, and Poissonian statistics (Cash statistics – Cstat, Cash 1979) was applied. All the reported errors are at 1σ confidence level.
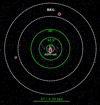 |
Fig. 2. 0.5–7 keV image of NGC 5141 in logarithmic scale: the green annuli represent the extraction regions used to perform the spatially resolved spectral analysis of the diffuse emission. The dashed white annulus is the chosen background region. |
3.1. Nuclear region: core and jet
We analyzed the nucleus of the source. The X-ray spectrum was extracted from a circular region of 1.3″ to exclude the abovementioned southern jet contribution. The nucleus best-fit model is a power-law that is absorbed by an intrinsic column density in addition to the Galactic one5 (Cstat = 75.4, for 79 degrees of freedom, hereafter d.o.f.). Although the total number of counts was limited (185), we could estimate the spectral index and the intrinsic absorption, Γ = 1.3 ± 0.3 and NHint = 6 ± 2 × 1021 cm−2, which are compatible with the analysis of Kharb et al. (2012). The intrinsic soft X-ray attenuation can be ascribed to the central dust lane detected with HST (Verdoes Kleijn et al. 1999; van Bemmel et al. 2012).
The rest frame (unabsorbed) luminosity between 2–10 keV is  erg s−1. Given the BH mass (see Sect. 2), the Eddigton normalized X-ray luminosity is L2 − 10 keV/LEdd = (2 ± 1)×10−6, where LEdd is defined as 1.26 × 1038 MBH/M⊙ erg s−1. This value is well compatible with inefficiently accreting sources (e.g., Macconi et al. 2020), in agreement with the LERG optical classification.
The jet spectrum was extracted within a box (2.5″ × 3″) located at 1.3″ from the nucleus. The spectrum consists of 27 counts. The data were fitted with a power-law of spectral index Γjet = 2.2 ± 0.4 and a Galactic absorber (Cstat = 10.9 for 10 d.o.f.). The jet luminosity between 2–10 keV is  erg s−1, which is one order of magnitude lower than the nuclear one, as is generally observed in X-ray jets (see e.g., Sambruna et al. 2006).
3.2. Extended emission
A spectrum was extracted in a circular region of 30″ centered on the nucleus, after having excluded an elliptical region (semi-minor axis = 2″, semi-major axis = 4″) containing nucleus and jet (see Fig. 2). The selected region fully contains the galactic X-ray emission and roughly corresponds to the optical galactic scale (see Fig. 1-right panel).
The diffuse emission was fitted with a thermal model (APEC, Astrophysical Plasma Emission Code, Smith et al. 2001), attenuated by Galactic absorption. Given the poor statistics, we could not constrain the metal abundance that was kept fixed to the solar value. Although the model was acceptable (Cstat = 106.6 for 110 d.o.f.), an excess of photons above 1 keV was still present in residuals. A power-law was then added to the thermal model. The fit strongly improved, giving a C-stat value of 68.8 for 108 d.o.f. The best-fit parameters were kT = 0.80 ± 0.05 keV for the diffuse emission and Γ = 1.5 ± 0.3 for the power-law. The hard slope and the 0.5–8 keV power-law luminosity (calculated in the energy range usually adopted in literature), L0.5 − 8 keV = (2.8 ± 0.8)×1040 erg s−1, are fully consistent with unresolved emission from bright low-mass X-ray binaries (LMXBs) typically observed in early-type galaxies (Irwin et al. 2003; Boroson et al. 2011; Lehmer et al. 2019).
As we were interested in the properties of the gas surrounding the cavity, our best-fit model (APEC+POWER-LAW) was applied individually to three spectra extracted from concentric annuli with 6, 17.5, and 30 arcseconds radii, respectively (see Fig. 2). Low counts preclude fitting several parameters to each spectrum, so we kept Γ fixed at 1.5 while fitting to find the temperature in each annulus. We obtained:  keV, kT6 − 17.5″ = 0.89 ± 0.07 keV, and
  keV. Thus, since in all three annuli the temperatures are compatible with that in the 0–30″ region, in each annulus both the temperature (kT = 0.80 keV) and power-law index (Γ = 1.5) were frozen.
In order to take projection effects into account, the multiplicative model PROJCT was applied to the APEC component (see Table 1 for model description and best-fit values). The PROJCT model deprojects 2D spectra, assuming spherical symmetry. The deprojected APEC normalization (NAPEC) is directly connected to the thermal component emission measure6: EM = ∫nenHdV. For a collisional ionized plasma with solar abundance,  (see e.g., Gitti et al. 2012)7 is calculated through the formula
  , where X, Y, and Z are the mass fraction of hydrogen, helium, and metals, respectively, thus, given NAPEC, the gas density
![Mathematical equation: $$ \begin{aligned} n_{\rm e}=\sqrt{\frac{4\pi \cdot 10^{14}\cdot N_{\rm APEC} \cdot [D_L/(1+z)]^2 }{0.82 \cdot V}} \end{aligned} $$](/articles/aa/full_html/2022/04/aa43024-21/aa43024-21-eq8.gif) (1)
(1)
can be obtained for each shell. The ne radial profile is shown in the left panel of Fig. 3. The power-law was left out of deprojection with its slope frozen to 1.5 and its normalization free to vary (see Su et al. 2017; Lakhchaura et al. 2018, for an analogous analysis procedure). Spectral results are reported in Table 1.
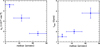 |
Fig. 3. Radial profile of density (left panel) and cooling time (right panel) of the three concentric regions as calculated in Sect. 4.2 and described in Table 1. |
We also tested a deprojected model for both the power-law and thermal components (PROJCT*TBABS*(POWER-LAW+APEC)), which is valid in the case that the LMXBs have a spherical distribution. Also in this case, we froze both kT and Γ values to the 0–30″ ones. The deprojected APEC normalization is fully compatible with our best-fit model (see Table 1 for comparison): N0 − 6″ < 3 × 10⁻⁷,  and
and  .
.
3.3. X-ray cavity significance
The most intriguing feature in the X-ray image is the depression partially coincident with the northern radio lobe, suggestive of an interaction between the lobe plasma and the surrounding gas (see Fig. 1). It cannot be excluded that an X-ray cavity overlapping with the southern lobe is also present. However, the low surface brightness and the lack of bright surrounding hot gas make the detection difficult. A deeper X-ray observation is necessary to confirm whether the jet has excavated the ISM around the southern radio lobe.
We assumed that the northern X-ray cavity is spherical with a radius of 4.5″ (yellow dashed circle in Fig. 1). To test the significance of the depression, we compared the number of counts per unit area inside the cavity (0.094 counts arcsec−2) with a control region. The control region is chosen as the annulus extending from 6″ to 15″ from the AGN (i.e., spanning the radial extent of the cavity region), from which the cavity region and its surrounding bright rims were excluded. The resulting control region surface brightness is 0.255 counts arcsec−2 (the control region, i.e., the annulus minus rims, is shown in Fig. A.1). Therefore, the surface brightness is found to be reduced by ≈60% within the X-ray cavity with an associated significance level of ≈4σ (following the method in Ubertosi et al. 2021)8. Compared to the typical drops observed in clusters (i.e., ≈20 − 40% below the surrounding gas level), the brightness depression is higher. The strong anisotropic NGC 5141 gas distribution could lead to the lack of galactic gas in the cavity background-foreground regions (if compared to sources with richer gas amount, e.g., clusters) and it could be responsible for such a deep depression.
However, we also performed additional tests to corroborate our result, exploiting different control regions. As detailed in Appendix A, we found a depression percentage varying between 40–70% and a significance ranging between 2–5σ.
These tests strengthen the X-ray cavity detection. Considering the low statistics and the less uniform gas distribution in this galaxy than in clusters, we are confident that the cavity in this galaxy is reliable (see also Sect. 4.3).
4. AGN heating versus cooling
4.1. Heating
A study of jet-ISM feedback needs the gas surrounding the cavity to be characterized. As shown in Fig. 3 (left panel), the ISM density decreases with increasing distance from the center. In the 6″ − 17.5″ annulus, where the cavity is found, the density is ne = (3.3 ± 0.3)×10−3 cm−3. Given ne, and adopting n = np + ne ∼ 1.82ne (e.g., Gitti et al. 2012), the gas pressure can be calculated as P = nkT ≈ 1.82nekT ≈ (7.7 ± 0.9)×10−12 erg cm−3.
The energy required to excavate the medium is the sum of the work done by the lobes (PV) and their thermal energy (McNamara & Nulsen 2007). It can be expressed as
with γ being the ratio of the specific heats and Vcav being the volume of the cavity. For γ = 4/3, which is appropriate for a relativistic plasma, and a spherical cavity of radius RC = 4.5″ (see the dashed yellow circle in Fig. 1), we obtain: Ecav = (1.5 ± 0.2)×1055 erg.
To determine the average jet power required to push aside the ISM gas, an estimate of the cavity age is necessary. We considered three different methods (Bîrzan et al. 2004) to calculate the time (t): (i) the cavity is assumed to rise through the hot gas atmosphere at the sound speed (ts); (ii) the cavity is assumed to rise buoyantly (tb); and (iii) the cavity age is the time required to refill the displaced volume (tr).
In detail, ts is expressed as the ratio between the projected distance of the cavity from the center (D = 10.5″) and the sound speed  , with γ = 5/3 (monoatomic gas) and μ, the mean molecular weight, being equal to 0.61 once that the solar abundance is assumed. In the second case, the estimated age is expressed as
  , where the gravitational acceleration is estimated as
  (Bîrzan et al. 2004). Here the stellar velocity is σ⋆ = 242 ± 4 km s−1 as provided by Data Release 16 (DR16) of the SDSS9. The term C is the drag coefficient assumed to be 0.75 (Churazov et al. 2001), and
  is the X-ray cavity cross section. The refill time was calculated as
  . The estimated ages and the resulting cavity power, Pcav = Ecav/tcav, are listed in Table 2.
Cavity power calculated considering the three different age methods (sound, buoyant and refill times, see text for details).
We note that there are systematic errors for two of the age estimates. Projection effects mean that the distance from the AGN to the center of the cavity is likely underestimated, leading to underestimates of the ages. As reported by Giovannini et al. (2001), the jet inclination angle of 4C +36.24 should be 58° or less. On the other hand, we have assumed that the radio bubble was formed close to the AGN and traveled to its current location. If the bubble was excavated by the jet further from the core, these ages may be overestimates.
Since different metallicities can alter the APEC normalization (NAPEC) and the X-ray fit cannot constrain the gas metallicity, we considered various metallicity values for the hot gas thermal emission in the fit and we recalculated the cavity power. Even considering an extensive range of possible metallicities, from 0.3 to 2 solar abundances, Pcav is found to range from ≈9.6 × 1040 erg s−1 to ≈3.5 × 1040 erg s−1, respectively. Thus, the estimated cavity power is within a factor 2 from our best-fit estimate (solar abundance): given the large uncertainties in the Pcav estimate, the metallicity does not have a tremendous impact.
The cavity age (tcav ∼ 8 − 14 Myrs) is larger than the upper limit on the radiative age trad < 4 Myrs, found by Parma et al. (1999). We notice that the radiative age would be compatible with the cavity sound expansion time (tse), that is the time that is necessary for the cavity to reach the current size, expanding at the sound speed, and assuming that it was produced in the current position: tse = RC/cs ≈ 3.3 Myrs.
The source radiative age was estimated by using the radio lobes spectral index steepening between 1.4 and 5 GHz (interpreted as electron aging due to synchrotron and inverse Compton losses) and by calculating a magnetic field strength through the “minimum energy assumption”. The energy break was estimated as a lower limit (> 30 GHz) for this source, implying that only an upper limit on the radiative time can be obtained. Due to the discrepancy between trad and tcavity, a comparison between X-ray cavity power and radio power is prevented.
4.2. Cooling
Once the ISM temperature and density values are known, the time required by the ISM to efficiently cool through radiative emission can be calculated for each annulus as follows:
 (2)
(2)
Here γ = 5/3, μ ≈ 0.61, and X is the hydrogen mass fraction (X = 0.71 for solar abundances). According to the source temperature and metallicity, the cooling function is Λ = 3.5 × 10⁻²³ erg cm3 s−1 (Sutherland & Dopita 1993). The estimated cooling times are shown in Fig. 3 (right panel). The cooling radius (rcool) is generally defined as the radius within which the cooling time equals the age of the system (tsys). It delimits the region where the ISM effectively cools and where the cooling luminosity (Lcool), that is the thermal X-ray bolometric luminosity (0.1–100 keV), is measured. In order to compare our results with similar systems found in literature, we chose the commonly adopted 7.7 Gyrs as the maximum cooling time of the system (corresponding to the lookback time at z = 1, see, e.g., Bîrzan et al. 2004, 2008; Cavagnolo et al. 2010; Eckert et al. 2021). Since this is longer than the cooling time of each analyzed annulus, the entire 0–30″ region lies inside the cooling radius; thus, we could estimate the ISM cooling luminosity from the corresponding spectra (excluding the AGN and jet), finding: Lcool = (2.1 ± 0.3)×1040 erg s−1. Conversely, if we consider 3 Gyrs as the threshold (also proposed as a typical cooling time threshold within groups and clusters hosting cavities, see Panagoulia et al. 2014), the cooling luminosity would be calculated within the two innermost regions (within 17.5″, see Fig. 3-right panel). Its value would not have changed dramatically (within a factor 2): Lcool ≈ 1.2 × 1040 erg s−1.
Given both NGC 5141’s X-ray cavity power and its cooling luminosity, it is possible to investigate whether the system is balanced or not. Since the two quantities are comparable (i.e., Pcav/Lcool = 3 ± 1), we conclude that the heating power is able to balance the cooling within NGC 5141. In Fig. 4, taken from Gitti et al. (2012), the X-ray cooling luminosity versus the cavity power is shown for different systems with cavities (clusters from Bîrzan et al. 2008, groups from O’Sullivan et al. 2011 and giant elliptical galaxies from Cavagnolo et al. 2010). NGC 5141 (magenta star), included in the plot, follows the general trend.
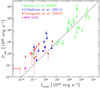 |
Fig. 4. X-ray cooling luminosity (see Sect. 3) versus cavity power (calculated as Pcav = E/tb) from Gitti et al. (2012). NGC 5141 is the magenta star (see Table 2 for values). The cavity energy is estimated as E = 4pV. Different symbols denote systems in different samples: green triangles are clusters from Bîrzan et al. (2008), red squares are giant ellipticals from Cavagnolo et al. (2010) and blue circles are groups from O’Sullivan et al. (2011). NGC 3608, which is part of the Cavagnolo et al. (2010) sample, is highlighted as the yellow-filled square with red edges. The diagonal line indicates Pcav = Lcool. If cooling is exactly balancing heating, the content of the X-ray cavities is fully relativistic and Pcav = Pjet, thus the data points should be on the line. |
4.3. Comparison with the literature
Shin et al. (2016) collected a large sample of cavities (148 in total), detected by Chandra with exposure times ranging from a few to hundreds of kilo-seconds. Their sample covers an extensive dynamical range (from isolated galaxies to rich clusters). NGC 5141 can be included in their relations: in Fig. 5, the cavities’ distance from the system center is compared to their linear size (left panel) and area (central panel), while in the right panel the system gas temperature is plotted against the cavity area. NGC 5141 is indicated through a magenta star. It follows all the correlations found by Shin et al. (2016) with a good agreement: this indirectly supports the reliability of the cavity detection in NGC 5141.
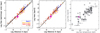 |
Fig. 5. Plots adapted from Shin et al. 2016, which show their large X-ray cavity sample properties, as observed in various environments (isolated galaxies, groups, and clusters). The NGC 5141 (the magenta star) size, distance from the center, and temperature are compared with this sample. Left panel: distance from the center versus linear size for cavities. Central panel: distance versus area for cavities. Right panel: X-ray gas temperature versus cavity area. |
To the best of our knowledge, there are only two galaxies in the literature characterized by as low a total cavity power as NGC 5141 (i.e., < 1041 erg s−1): NGC 3608 (part of the Cavagnolo et al. 2010 sample, see Fig. 4) and NGC 4477. NGC 3608 is a galaxy showing cavities with similar Pcav to NGC 5141 (≈1040 erg s−1 in total, Cavagnolo et al. 2010; it is represented in Fig. 4 by the yellow-filled red square in the bottom left corner). NGC 4477 hosts the smallest cavity structures known in terms of size, distance from the center, and cavity power (≈1039 erg s−1, see Li et al. 2018). As mentioned in Sect. 1, it along with NGC 193 are the only two S0 galaxies with cavities known (NGC 193 shows three prominent cavities with a high cavity power: ≈1042 − 1043, Bogdán et al. 2014). NGC 4477 is not in Fig. 4: a direct comparison with the other systems is not possible since a different cooling time threshold was adopted (Li et al. 2018). However, there are important differences with NGC 5141: (i) both NGC 3608 and NGC 4477 have a cooler ISM (kT ≈ 0.3 keV); (ii) they show multiple cavities within their galaxy; and, most importantly, (iii) they do not exhibit extended radio emission, precluding direct evidence for a connection between jet activity and X-ray cavities and they are therefore named ghost cavities (Bîrzan et al. 2004). NGC 3608 was not detected in the radio band recently, even with LOFAR (Bîrzan et al. 2020). In conclusion, NGC 5141 represents a unique example of a galaxy possessing a low-power X-ray cavity clearly connected to jet activity. This enables us to expand the Pcav/Lcool relation at the lower limits in terms of power for radio-filled sources.
5. Summary and conclusions
We report the discovery of an X-ray cavity within the ISM of NGC 5141. The X-ray cavity is located in the northeast region of the galaxy within a few kiloparsecs from the central AGN, and it partially corresponds to the northern radio lobe. NGC 5141 is classified in the radio band as a small low-power FRI whose emission is contained within the optical galaxy.
The X-ray cavity size, area, and distance from the AGN, as well as the temperature of the surrounding medium, follow the correlations found by Shin et al. (2016) (Fig. 5). This agreement, together with the tests discussed in Sect. 3.3 and Appendix A, corroborates the robustness of our cavity detection.
The total energy required to inflate the X-ray cavity is Ecav = (1.5 ± 0.2)×1055 erg. Assuming that it was produced in the core surroundings and that it rose buoyantly to the current position, a cavity age can be estimated as tb = 8.6 ± 0.3 Myrs (see also Table 2 for the cavity ages estimated following different methods). Then, the cavity power is Pcav = Ecav/tb = (5.6 ± 0.8)×1040 erg s−1. We note that Pcav can be compared to the cooling luminosity of the system (Lcool = (2.1 ± 0.3)×1040 erg s−1, i.e., X-ray bolometric luminosity inside rcool, see Sect. 4.2) to evaluate the heating-cooling balance: in Fig. 4, the cavity power and the cooling luminosity of NGC 5141 are compared to those observed in clusters, groups, and galaxies. Our source, in the lower left corner of the plot, follows the Pcav = Lcool correlation, attesting that this connection is present within systems ranging from Pcav ∼ 1046 erg s−1 down to 1040 erg s−1.
NGC 5141 represents a unique source because: (i) its single cavity has the weakest Pcav value among known radio-filled systems, allowing us to confirm the heating-cooling balance at the lowest edge of radio galaxy power and size; and (ii) it represents a rare signature of jet-ISM interaction found in a small lenticular-elliptical galaxy. If it is a lenticular, it would be the third S0 galaxy hosting an X-ray cavity after NGC 193 and NGC 4477.
From NED https://ned.ipac.caltech.edu/
They fit the SDSS DR8 galaxies with stellar spectral templates, considering two stellar initial mass functions (IMFs, Salpeter and Kroupa models) and two stellar population (SP) templates (passive and star-forming galaxies). In this framework, NGC 5141 has a best-fit age ranging from 11.75 Gyrs to > 13 Gyrs, taking different IMF and SP.
Calculated as follows: ![Mathematical equation: $ L_{1.4}=10^{-23}4\pi D_L^2F_{\mathrm{obs}}^{[\mathrm{Jy}]}\nu_{1.4}/(1+z)^{\alpha+1} $](/articles/aa/full_html/2022/04/aa43024-21/aa43024-21-eq18.gif) with α = −0.75 measured by Parma et al. (1999).
with α = −0.75 measured by Parma et al. (1999).
NHGal = 1.02 × 1020 cm−2, Kalberla et al. (2005).
The APEC normalization is NAPEC=![Mathematical equation: $ \frac{10^{-14}\int n_{\mathrm{e}} n_{\mathrm{H}} \mathrm{d}V}{4\pi [D_A(1+z)]^2} $](/articles/aa/full_html/2022/04/aa43024-21/aa43024-21-eq19.gif) with
with  being the angular diameter distance (cm), DL the luminosity distance (DL = 75.5 Mpc with the adopted cosmology), z the redshift of the source, V the volume of the emitting region, and ne and nH the electron and H densities (cm−3), respectively. The number densities (ne, nH) are integrated over the spherical shell volume.
The total particles density n = ne + np (i.e., neglecting nuclei).
The percentage depression (D) was calculated as follows:  , where SCAV is the cavity surface brightness and SCR is the control region surface brightness. The cavity significance was calculated as D/ΔD, where ΔD was calculated through surface brightness propagation of uncertainty.
Acknowledgments
D.M. gratefully acknowledges the INAF-OAS Ph.D. fellowship. The authors wish also to thank the anonymous referee for useful comments and suggestions that have improved the paper.
References
- Arnaud, K. A. 1996, in Astronomical Data Analysis Software and Systems V, eds. G. H. Jacoby, & J. Barnes, ASP Conf. Ser., 101, 17 [NASA ADS] [Google Scholar]
- Best, P. N., & Heckman, T. M. 2012, MNRAS, 421, 1569 [NASA ADS] [CrossRef] [Google Scholar]
- Bîrzan, L., Rafferty, D. A., McNamara, B. R., Wise, M. W., & Nulsen, P. E. J. 2004, ApJ, 607, 800 [Google Scholar]
- Bîrzan, L., McNamara, B. R., Nulsen, P. E. J., Carilli, C. L., & Wise, M. W. 2008, ApJ, 686, 859 [Google Scholar]
- Bîrzan, L., Rafferty, D. A., Brüggen, M., et al. 2020, MNRAS, 496, 2613 [CrossRef] [Google Scholar]
- Boehringer, H., Voges, W., Fabian, A. C., Edge, A. C., & Neumann, D. M. 1993, MNRAS, 264, L25 [NASA ADS] [CrossRef] [Google Scholar]
- Bogdán, Á., van Weeren, R. J., Kraft, R. P., et al. 2014, ApJ, 782, L19 [CrossRef] [Google Scholar]
- Boroson, B., Kim, D.-W., & Fabbiano, G. 2011, ApJ, 729, 12 [NASA ADS] [CrossRef] [Google Scholar]
- Calvani, M., Fasano, G., & Franceschini, A. 1989, AJ, 97, 1319 [Google Scholar]
- Capetti, A., Massaro, F., & Baldi, R. D. 2017, A&A, 598, A49 [NASA ADS] [CrossRef] [EDP Sciences] [Google Scholar]
- Carilli, C. L., Perley, R. A., & Harris, D. E. 1994, MNRAS, 270, 173 [NASA ADS] [Google Scholar]
- Cash, W. 1979, ApJ, 228, 939 [Google Scholar]
- Caswell, J. L., & Wills, D. 1967, MNRAS, 135, 231 [NASA ADS] [CrossRef] [Google Scholar]
- Cavagnolo, K. W., McNamara, B. R., Nulsen, P. E. J., et al. 2010, ApJ, 720, 1066 [Google Scholar]
- Churazov, E., Brüggen, M., Kaiser, C. R., Böhringer, H., & Forman, W. 2001, ApJ, 554, 261 [NASA ADS] [CrossRef] [Google Scholar]
- Churazov, E., Sunyaev, R., Forman, W., & Böhringer, H. 2002, MNRAS, 332, 729 [NASA ADS] [CrossRef] [Google Scholar]
- Condon, J. J., & Broderick, J. J. 1988, AJ, 96, 30 [NASA ADS] [CrossRef] [Google Scholar]
- Condon, J. J., Cotton, W. D., Greisen, E. W., et al. 1998, AJ, 115, 1693 [Google Scholar]
- Courteau, S., Andersen, D. R., Bershady, M. A., MacArthur, L. A., & Rix, H.-W. 2003, ApJ, 594, 208 [NASA ADS] [CrossRef] [Google Scholar]
- Eckert, D., Gaspari, M., Gastaldello, F., Le Brun, A. M. C., & O’Sullivan, E. 2021, Universe, 7, 142 [NASA ADS] [CrossRef] [Google Scholar]
- Emonts, B. H. C., Morganti, R., Struve, C., et al. 2010, MNRAS, 406, 987 [NASA ADS] [Google Scholar]
- Fabian, A. C. 1994, ARA&A, 32, 277 [Google Scholar]
- Fabian, A. C. 2012, ARA&A, 50, 455 [Google Scholar]
- Ferrarese, L., & Merritt, D. 2000, ApJ, 539, L9 [Google Scholar]
- Gebhardt, K., Bender, R., Bower, G., et al. 2000, ApJ, 539, L13 [Google Scholar]
- Giovannini, G., Cotton, W. D., Feretti, L., Lara, L., & Venturi, T. 2001, ApJ, 552, 508 [NASA ADS] [CrossRef] [Google Scholar]
- Gitti, M., Brighenti, F., & McNamara, B. R. 2012, Adv. Astron., 2012, 950641 [CrossRef] [Google Scholar]
- Gonzalez-Serrano, J. I., Carballo, R., & Perez-Fournon, I. 1993, AJ, 105, 1710 [Google Scholar]
- Greene, J. E., & Ho, L. C. 2006, ApJ, 641, L21 [Google Scholar]
- Huertas-Company, M., Aguerri, J. A. L., Bernardi, M., Mei, S., & Sánchez Almeida, J. 2011, A&A, 525, A157 [NASA ADS] [CrossRef] [EDP Sciences] [Google Scholar]
- Irwin, J. A., Athey, A. E., & Bregman, J. N. 2003, ApJ, 587, 356 [NASA ADS] [CrossRef] [Google Scholar]
- Jaffe, W. J., & Perola, G. C. 1973, A&A, 26, 423 [NASA ADS] [Google Scholar]
- Kalberla, P. M. W., Burton, W. B., Hartmann, D., et al. 2005, A&A, 440, 775 [NASA ADS] [CrossRef] [EDP Sciences] [Google Scholar]
- Kharb, P., O’Dea, C. P., Tilak, A., et al. 2012, ApJ, 754, 1 [NASA ADS] [CrossRef] [Google Scholar]
- Lakhchaura, K., Werner, N., Sun, M., et al. 2018, MNRAS, 481, 4472 [NASA ADS] [CrossRef] [Google Scholar]
- Lehmer, B. D., Eufrasio, R. T., Tzanavaris, P., et al. 2019, ApJS, 243, 3 [NASA ADS] [CrossRef] [Google Scholar]
- Li, Y., Su, Y., & Jones, C. 2018, MNRAS, 480, 4279 [NASA ADS] [CrossRef] [Google Scholar]
- Macconi, D., Torresi, E., Grandi, P., Boccardi, B., & Vignali, C. 2020, MNRAS, 493, 4355 [NASA ADS] [CrossRef] [Google Scholar]
- Magorrian, J., Tremaine, S., Richstone, D., et al. 1998, AJ, 115, 2285 [Google Scholar]
- Makishima, K., Ezawa, H., Fukuzawa, Y., et al. 2001, PASJ, 53, 401 [NASA ADS] [CrossRef] [Google Scholar]
- Maraston, C. 2005, MNRAS, 362, 799 [NASA ADS] [CrossRef] [Google Scholar]
- Maraston, C., Strömbäck, G., Thomas, D., Wake, D. A., & Nichol, R. C. 2009, MNRAS, 394, L107 [NASA ADS] [CrossRef] [Google Scholar]
- Marconi, A., & Hunt, L. K. 2003, ApJ, 589, L21 [Google Scholar]
- McNamara, B. R., & Nulsen, P. E. J. 2007, ARA&A, 45, 117 [NASA ADS] [CrossRef] [Google Scholar]
- McNamara, B. R., & Nulsen, P. E. J. 2012, New J. Phys., 14, 055023 [NASA ADS] [CrossRef] [Google Scholar]
- Nilson, P. 1973, Uppsala General Catalogue of Galaxies (Uppsala: Astronomiska Observatorium) [Google Scholar]
- Nulsen, P. E. J., Jones, C., Forman, W. R., et al. 2007, in Heating versus Cooling in Galaxies and Clusters of Galaxies, eds. H. Böhringer, G. W. Pratt, A. Finoguenov, & P. Schuecker, 210 [CrossRef] [Google Scholar]
- Ocaña Flaquer, B., Leon, S., Combes, F., & Lim, J. 2010, A&A, 518, A9 [Google Scholar]
- O’Sullivan, E., Giacintucci, S., David, L. P., et al. 2011, ApJ, 735, 11 [Google Scholar]
- Owen, F. N., & Laing, R. A. 1989, MNRAS, 238, 357 [NASA ADS] [CrossRef] [Google Scholar]
- Pagotto, I., Corsini, E. M., Dalla Bontà, E., et al. 2017, Astron. Nachr., 338, 841 [NASA ADS] [CrossRef] [Google Scholar]
- Panagoulia, E. K., Fabian, A. C., Sanders, J. S., & Hlavacek-Larrondo, J. 2014, MNRAS, 444, 1236 [NASA ADS] [CrossRef] [Google Scholar]
- Parma, P., Murgia, M., Morganti, R., et al. 1999, A&A, 344, 7 [NASA ADS] [Google Scholar]
- Pasini, T., Gitti, M., Brighenti, F., et al. 2021, ApJ, 911, 66 [NASA ADS] [CrossRef] [Google Scholar]
- Peterson, J. R., & Fabian, A. C. 2006, Phys. Rep., 427, 1 [Google Scholar]
- Planck Collaboration XIII. 2016, A&A, 594, A13 [NASA ADS] [CrossRef] [EDP Sciences] [Google Scholar]
- Rafferty, D. A., McNamara, B. R., Nulsen, P. E. J., & Wise, M. W. 2006, ApJ, 652, 216 [NASA ADS] [CrossRef] [Google Scholar]
- Ramella, M., Geller, M. J., & Huchra, J. P. 1989, ApJ, 344, 57 [NASA ADS] [CrossRef] [Google Scholar]
- Salim, S., Lee, J. C., Janowiecki, S., et al. 2016, ApJS, 227, 2 [NASA ADS] [CrossRef] [Google Scholar]
- Salim, S., Boquien, M., & Lee, J. C. 2018, ApJ, 859, 11 [Google Scholar]
- Sambruna, R. M., Gliozzi, M., Tavecchio, F., Maraschi, L., & Foschini, L. 2006, ApJ, 652, 146 [NASA ADS] [CrossRef] [Google Scholar]
- Shin, J., Woo, J.-H., & Mulchaey, J. S. 2016, ApJS, 227, 31 [NASA ADS] [CrossRef] [Google Scholar]
- Smith, R. K., Brickhouse, N. S., Liedahl, D. A., & Raymond, J. C. 2001, ApJ, 556, L91 [Google Scholar]
- Soares, D. S. D. L. 1989, Investigations of binary galaxies; Ph.D. Thesis, Univ. Groningen, The Netherlands [Google Scholar]
- Su, Y., Nulsen, P. E. J., Kraft, R. P., et al. 2017, ApJ, 847, 94 [NASA ADS] [CrossRef] [Google Scholar]
- Sutherland, R. S., & Dopita, M. A. 1993, ApJS, 88, 253 [Google Scholar]
- Tamura, T., Kaastra, J. S., Peterson, J. R., et al. 2001, A&A, 365, L87 [NASA ADS] [CrossRef] [EDP Sciences] [Google Scholar]
- Tremaine, S., Gebhardt, K., Bender, R., et al. 2002, ApJ, 574, 740 [NASA ADS] [CrossRef] [Google Scholar]
- Ubertosi, F., Gitti, M., Brighenti, F., et al. 2021, ApJ, 923, L25 [NASA ADS] [CrossRef] [Google Scholar]
- van Bemmel, I. M., Morganti, R., Oosterloo, T., & van Moorsel, G. 2012, A&A, 548, A93 [NASA ADS] [CrossRef] [EDP Sciences] [Google Scholar]
- Verdoes Kleijn, G. A., Baum, S. A., de Zeeuw, P. T., & O’Dea, C. P. 1999, AJ, 118, 2592 [Google Scholar]
- Véron-Cetty, M. P., & Véron, P. 2001, A&A, 375, 791 [NASA ADS] [CrossRef] [EDP Sciences] [Google Scholar]
- Willett, K. W., Lintott, C. J., Bamford, S. P., et al. 2013, MNRAS, 435, 2835 [Google Scholar]
Appendix A: X-ray cavity detection significance
We evaluated the X-ray cavity depression compared to the surrounding emitting gas level and its relative significance, exploiting three different control regions in addition to the one reported in Section 3.3 (i.e., annulus minus rims):
-
an annulus extending from 6" to 15" from the AGN (the same as in Section 3.3) from which we subtracted the cavity region itself (control region = annulus minus north cavity, see Figure A.1 where all the regions are highlighted). The resulting depression is ≈67% with a 4.9σ significance;
-
we removed all the brightest extended emission from the control region: we subtracted both the cavity rims and the bright west spot from the 6″ − 15″ annulus region (control region = annulus minus rims minus west spot). In this case, the cavity depression is ≈39% with a significance of 1.5σ;
-
from the same control region we excluded a putative southern cavity supposed to be at the same distance from the center as the northern cavity, with the same size and overlapping with the radio lobe emission (control region = annulus minus rims minus west spot minus south cavity). In this case, the depression is on the order of ≈45% with a significance of 1.9σ.
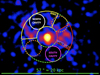 |
Fig. A.1. NGC 5141 X-ray image in the 0.5-7.0 keV band in logarithmic scale with σ = 2 pixels of Gaussian smoothing and scale parameter value ≥ 0.035 counts per pixel. The different control regions are highlighted: the 6"-15" annulus is in dashed green, the north cavity region is in white, the rim region is in yellow, the west spot region is in red, a possible south cavity is in purple and the two outer circles are in dotted orange. |
Furthermore, the significance level of the X-ray cavity detection was also checked with two additional circular regions, following Pasini et al. (2021): the net number of counts in the cavity (six) was compared to those contained in two outer circles with the same cavity area (orange dotted circles in Figure A.1). They were selected to be the nearest to the cavity region, at the same distance from the central AGN, but completely avoiding the emission from the bright rims that envelop the cavity. The significance of the cavity detection was calculated as a signal-to-noise ratio:  , where NI is the number of counts inside the cavity, and NO is the counts number of the region outside the cavity. The procedure is the same for the two circular regions adjacent to the cavity. In this way, we obtained ≈2σ significance comparing the cavity counts with both control regions.
All Tables
Cavity power calculated considering the three different age methods (sound, buoyant and refill times, see text for details).
All Figures
|
Fig. 1. NGC 5141 X-ray image in the 0.5–7.0 keV band using a logarithmic scale with σ = 2 pixels of Gaussian smoothing and a scale parameter value ≥0.035 counts per pixel. Left panel: three main X-ray features can be identified: (i) the nuclear region; (ii) an extended diffuse gas emission (cavity rims and western blob); and (iii) a cavity (dashed yellow circle). A zoom of the nonsmoothed nuclear region is shown in the top-right white panel: the core (iv) and the southern jet (v) are clearly visible. The green arrow points to the NGC 5142 optical center. Right panel: optical (dashed white) and radio VLA at 1.4 GHz (green; resolution = 1.4″, RMS = 0.1 mJy beam−1) contours overlap with the X-ray image, after having removed the nuclear emission (2″ × 4″ ellipse, see Sect. 3.2). The cavity position is indicated by the dashed yellow circle. The optical contours are taken from SDSS g-band emission within 70% of the NGC 5141 emitted light. The radio green contours are at −9, 9, 18, 36, 72, 144 × RMS; the image is taken from the NRAO Science Data Archive. |
| In the text | |
|
Fig. 2. 0.5–7 keV image of NGC 5141 in logarithmic scale: the green annuli represent the extraction regions used to perform the spatially resolved spectral analysis of the diffuse emission. The dashed white annulus is the chosen background region. |
| In the text | |
|
Fig. 3. Radial profile of density (left panel) and cooling time (right panel) of the three concentric regions as calculated in Sect. 4.2 and described in Table 1. |
| In the text | |
|
Fig. 4. X-ray cooling luminosity (see Sect. 3) versus cavity power (calculated as Pcav = E/tb) from Gitti et al. (2012). NGC 5141 is the magenta star (see Table 2 for values). The cavity energy is estimated as E = 4pV. Different symbols denote systems in different samples: green triangles are clusters from Bîrzan et al. (2008), red squares are giant ellipticals from Cavagnolo et al. (2010) and blue circles are groups from O’Sullivan et al. (2011). NGC 3608, which is part of the Cavagnolo et al. (2010) sample, is highlighted as the yellow-filled square with red edges. The diagonal line indicates Pcav = Lcool. If cooling is exactly balancing heating, the content of the X-ray cavities is fully relativistic and Pcav = Pjet, thus the data points should be on the line. |
| In the text | |
|
Fig. 5. Plots adapted from Shin et al. 2016, which show their large X-ray cavity sample properties, as observed in various environments (isolated galaxies, groups, and clusters). The NGC 5141 (the magenta star) size, distance from the center, and temperature are compared with this sample. Left panel: distance from the center versus linear size for cavities. Central panel: distance versus area for cavities. Right panel: X-ray gas temperature versus cavity area. |
| In the text | |
|
Fig. A.1. NGC 5141 X-ray image in the 0.5-7.0 keV band in logarithmic scale with σ = 2 pixels of Gaussian smoothing and scale parameter value ≥ 0.035 counts per pixel. The different control regions are highlighted: the 6"-15" annulus is in dashed green, the north cavity region is in white, the rim region is in yellow, the west spot region is in red, a possible south cavity is in purple and the two outer circles are in dotted orange. |
| In the text | |
Current usage metrics show cumulative count of Article Views (full-text article views including HTML views, PDF and ePub downloads, according to the available data) and Abstracts Views on Vision4Press platform.
Data correspond to usage on the plateform after 2015. The current usage metrics is available 48-96 hours after online publication and is updated daily on week days.
Initial download of the metrics may take a while.