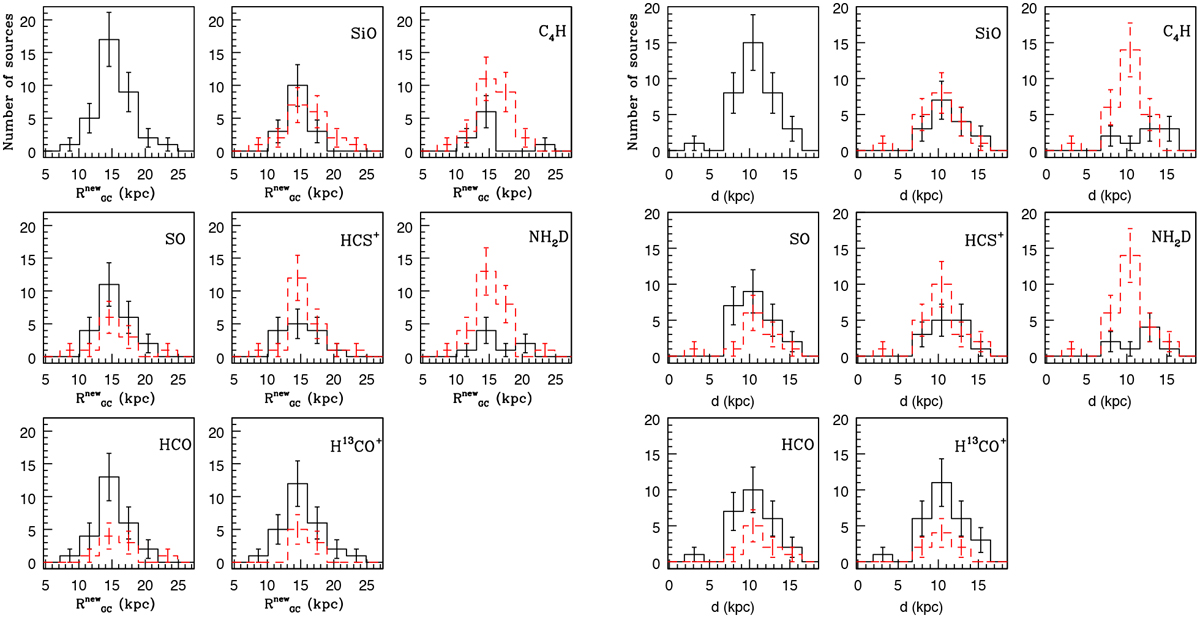
Fig. 2
Download original image
Histograms comparing the Galactocentric (left panels) and heliocentric (right panels) distance for detected (solid line) and undetected (red-dashed line) sources in the molecular species labelled in the top right corner of each panel. The top left panel includes the whole sample without distinguishing between detections and non-detections. Poissonian errorbars are given in each bin.
Current usage metrics show cumulative count of Article Views (full-text article views including HTML views, PDF and ePub downloads, according to the available data) and Abstracts Views on Vision4Press platform.
Data correspond to usage on the plateform after 2015. The current usage metrics is available 48-96 hours after online publication and is updated daily on week days.
Initial download of the metrics may take a while.