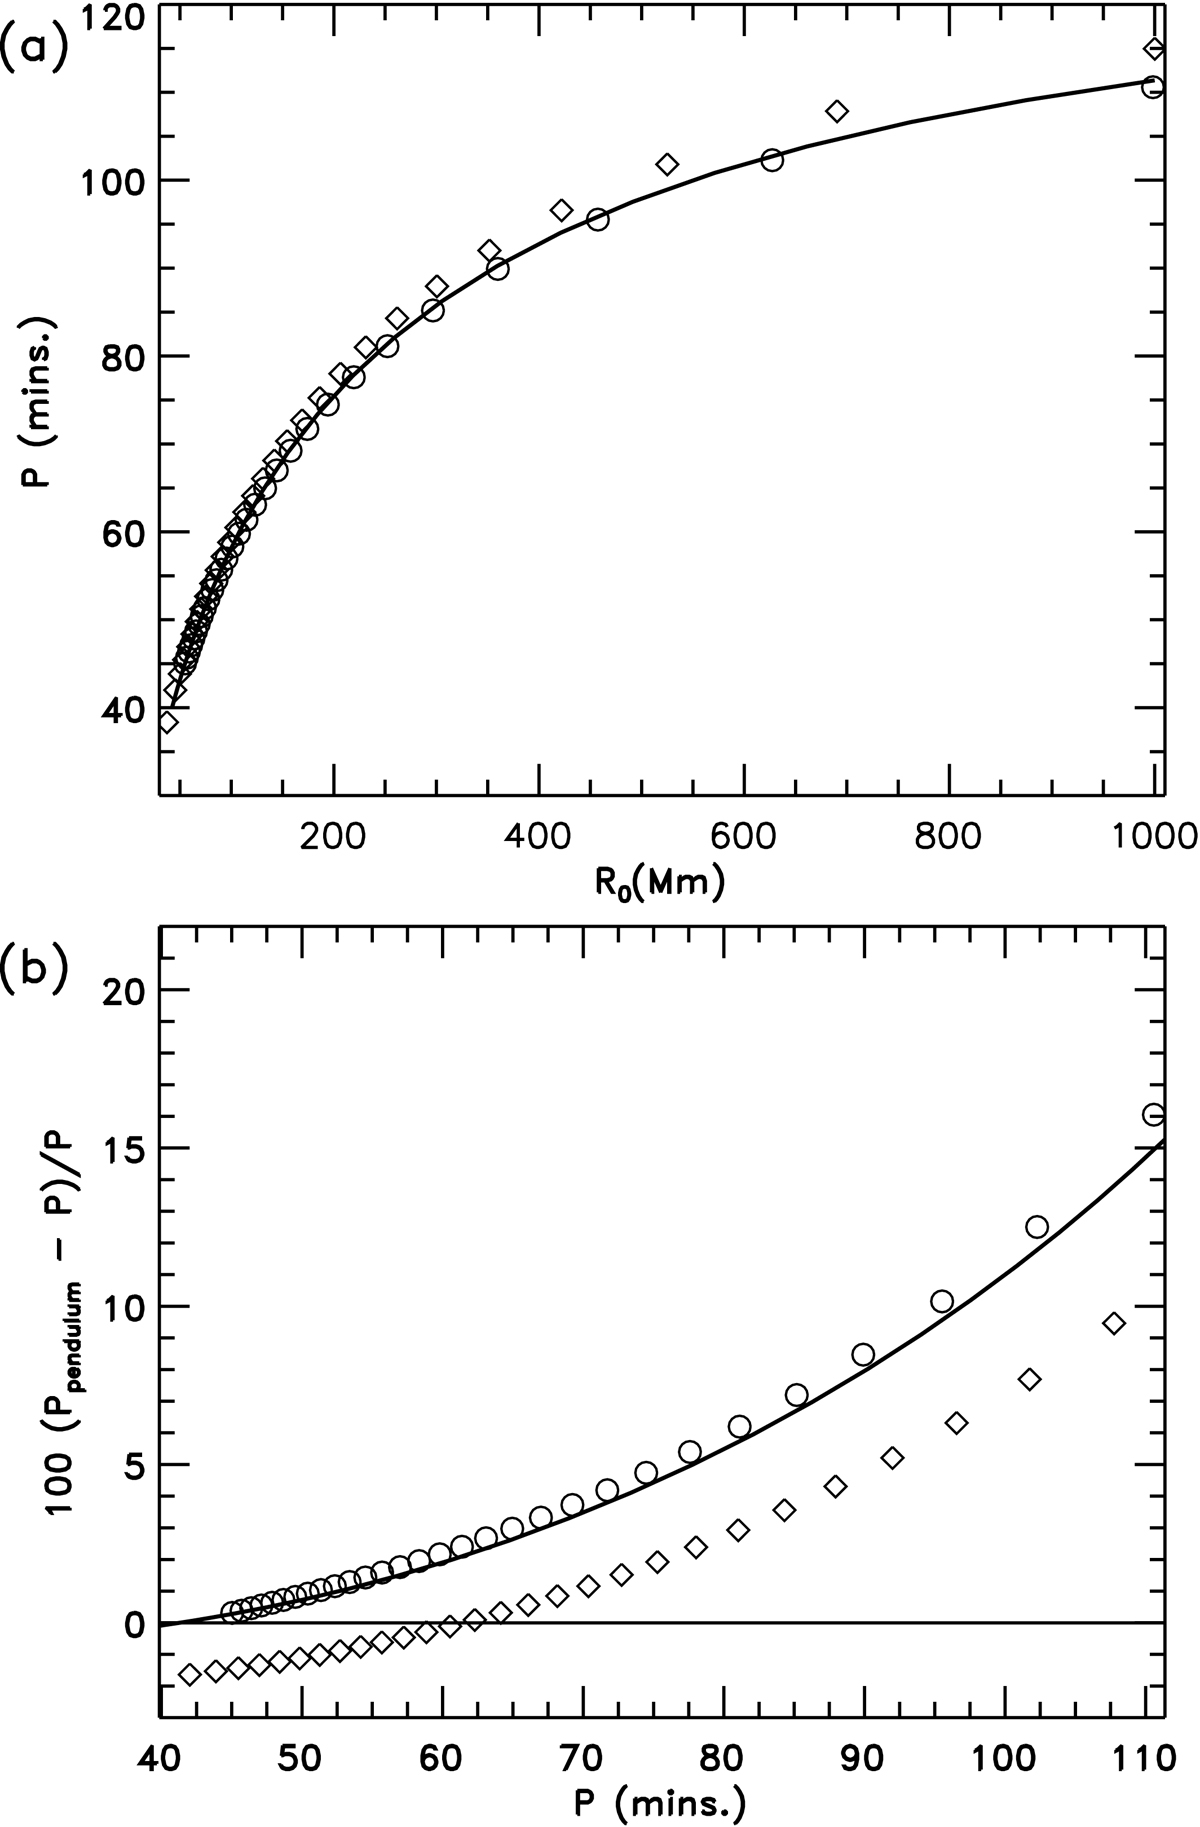
Fig. 7.
Download original image
Comparison of (a) period as a function of curvature radius at the bottom of the dip, R0, for the three geometries considered: Model 1 (solid line), Model 2 (circles), and Model 3 (diamonds). In (b) the comparison of the percentage of discrepancy between the exact period and that estimated by the corrected pendulum model (Eq. (17)) as a function of the exact period.
Current usage metrics show cumulative count of Article Views (full-text article views including HTML views, PDF and ePub downloads, according to the available data) and Abstracts Views on Vision4Press platform.
Data correspond to usage on the plateform after 2015. The current usage metrics is available 48-96 hours after online publication and is updated daily on week days.
Initial download of the metrics may take a while.