Free Access
Fig. 3.
Download original image
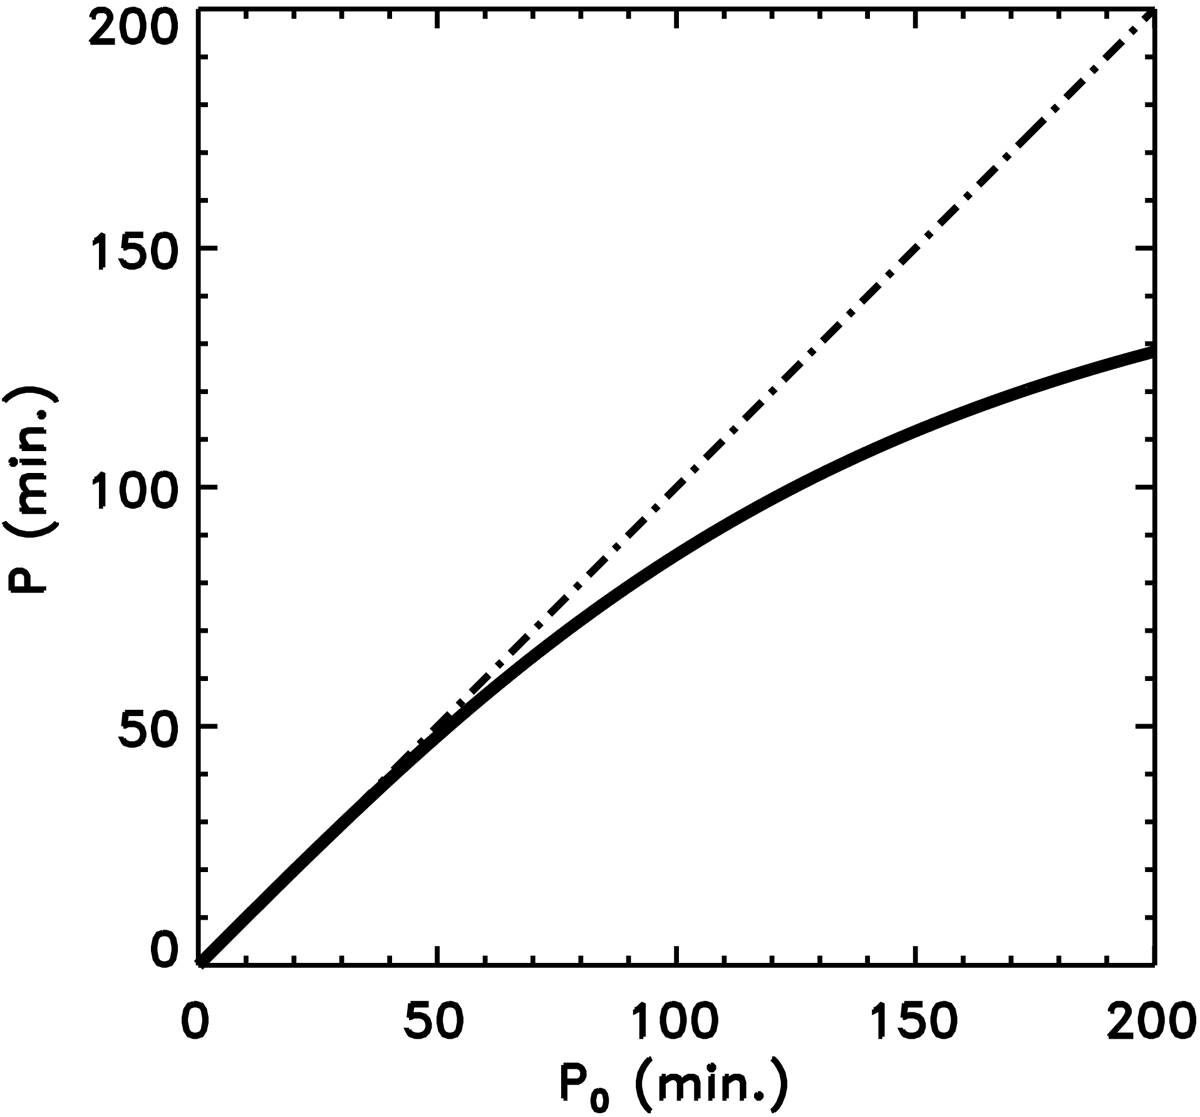
Corrected pendulum period Eq. (18) as a function of the old pendulum period P0 (solid line). The dot-dashed line is plotted to show the diagonal where P = P0. We see that the period deviates from the diagonal for periods larger than 50 min.
Current usage metrics show cumulative count of Article Views (full-text article views including HTML views, PDF and ePub downloads, according to the available data) and Abstracts Views on Vision4Press platform.
Data correspond to usage on the plateform after 2015. The current usage metrics is available 48-96 hours after online publication and is updated daily on week days.
Initial download of the metrics may take a while.