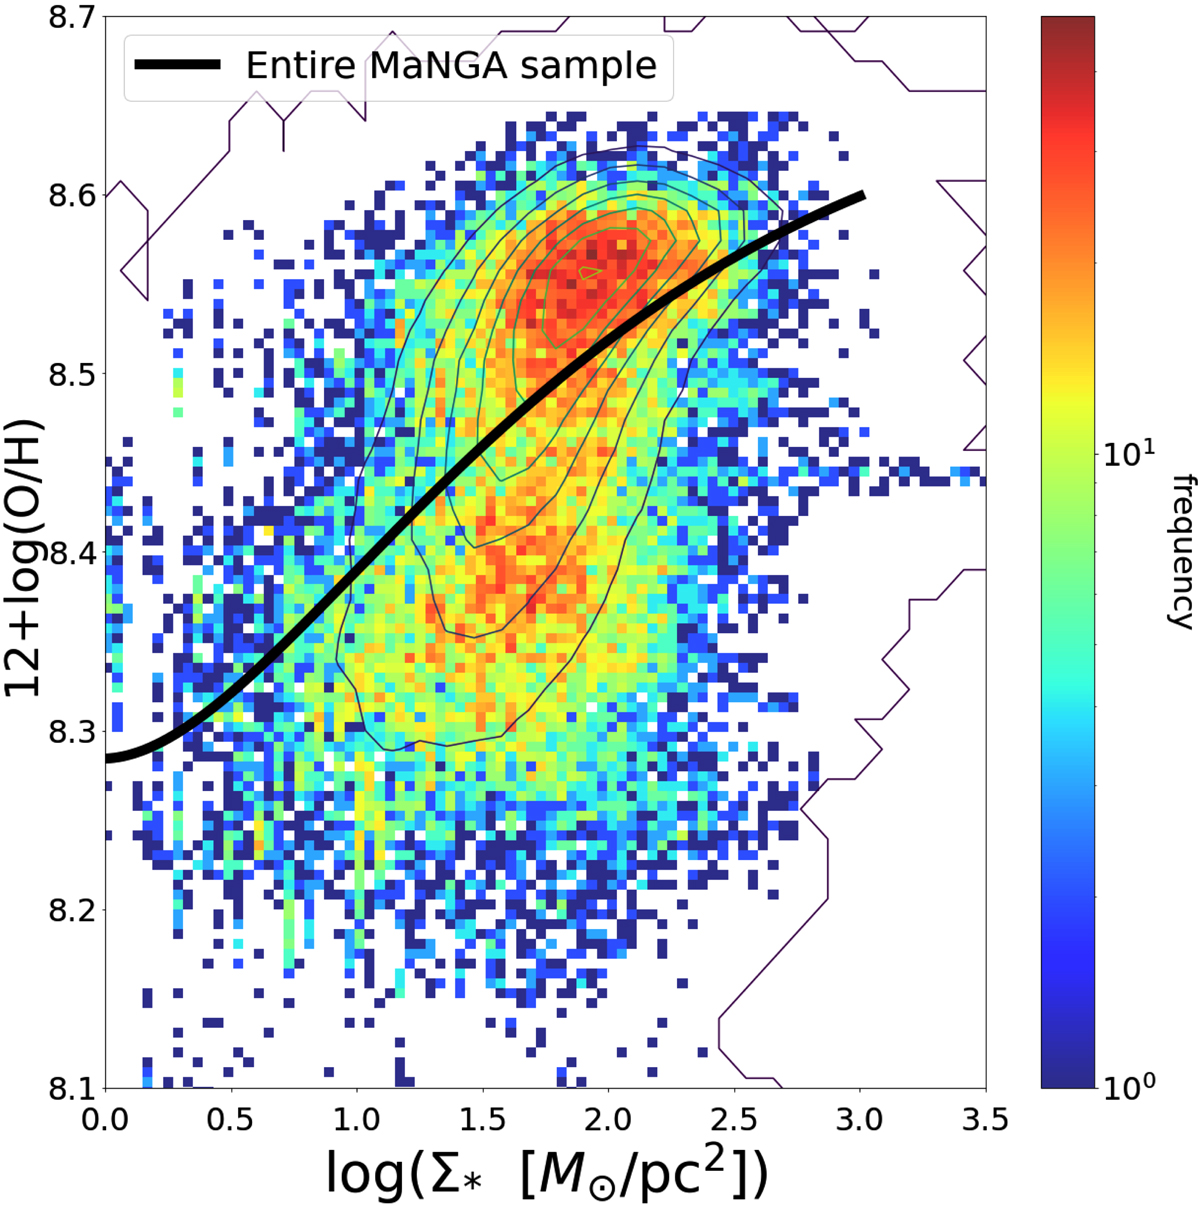
Fig. 2.
Download original image
Distribution of oxygen abundance as a function of stellar mass surface density for all star-forming spaxels in the 298 galaxy pairs in the MaNGA survey. The colour bar indicates the number of spaxels per bin in the Σ* − Z space. The black curve is the best-fit line found from the entire MaNGA sample. The contours indicate the distribution of all MaNGA spaxels.
Current usage metrics show cumulative count of Article Views (full-text article views including HTML views, PDF and ePub downloads, according to the available data) and Abstracts Views on Vision4Press platform.
Data correspond to usage on the plateform after 2015. The current usage metrics is available 48-96 hours after online publication and is updated daily on week days.
Initial download of the metrics may take a while.