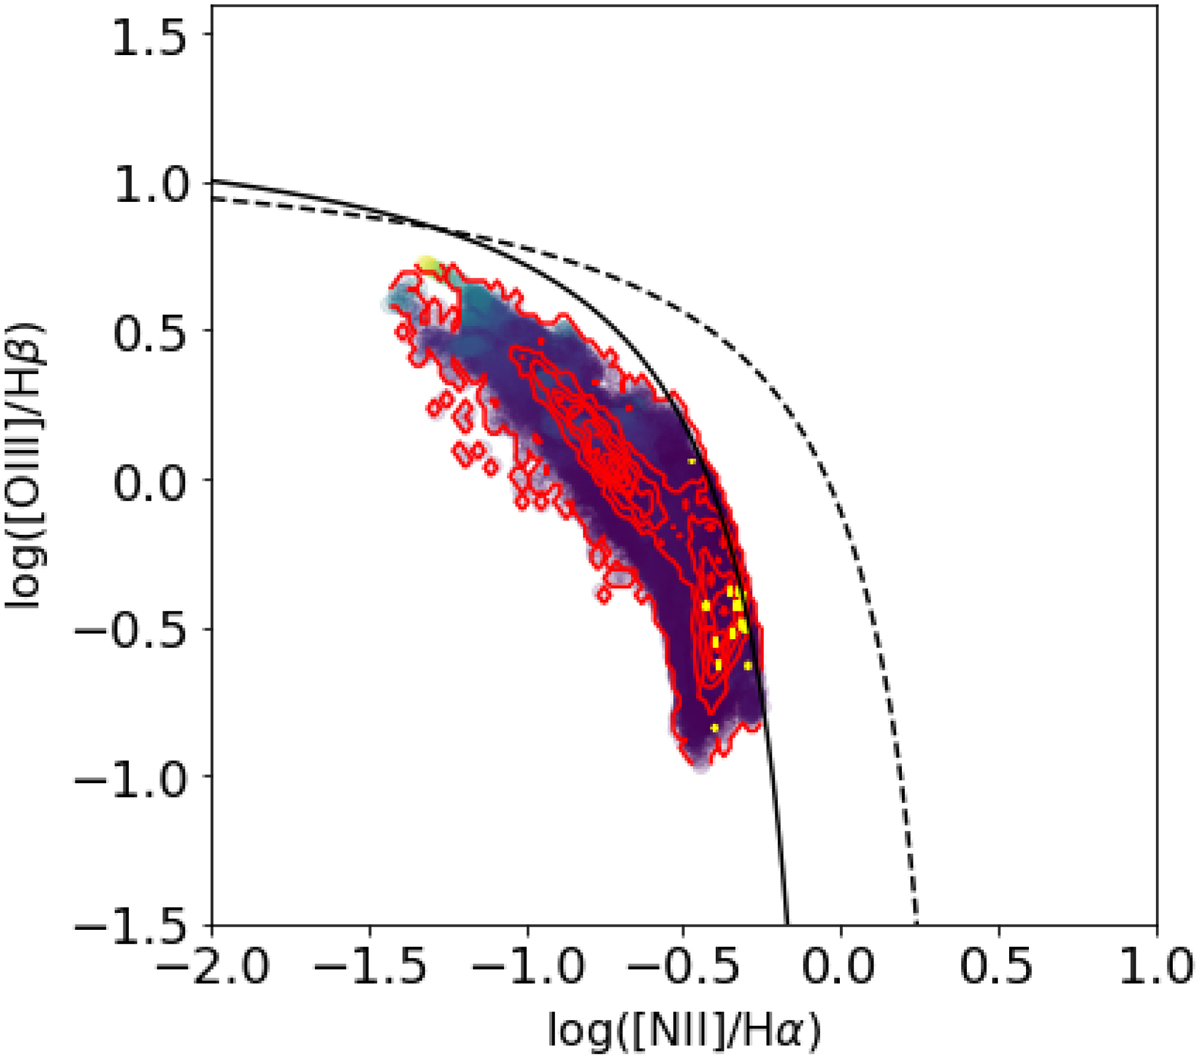
Fig. 1.
Download original image
Distribution of the spaxels of our sample of galaxy pairs shown in an [OIII]/Hβ and [NII]/Hα diagnostic diagram. The solid and dotted black lines are the star-forming and composite classification lines, respectively, defined in Kewley et al. (2006). The red and yellow contours represent the distribution of spaxels with Hα equivalent width greater than or less than 6 Å, respectively.
Current usage metrics show cumulative count of Article Views (full-text article views including HTML views, PDF and ePub downloads, according to the available data) and Abstracts Views on Vision4Press platform.
Data correspond to usage on the plateform after 2015. The current usage metrics is available 48-96 hours after online publication and is updated daily on week days.
Initial download of the metrics may take a while.