| Issue |
A&A
Volume 660, April 2022
|
|
|---|---|---|
| Article Number | A5 | |
| Number of page(s) | 10 | |
| Section | Astrophysical processes | |
| DOI | https://doi.org/10.1051/0004-6361/202142821 | |
| Published online | 30 March 2022 | |
3D hydrodynamical simulations of the impact of mechanical feedback on accretion in supersonic stellar-mass black holes
Departament de Física Quàntica i Astrofísica, Institut de Ciències del Cosmos (ICC), Universitat de Barcelona (IEEC-UB), Martí i Franquès 1, 08028 Barcelona, Spain
e-mail: This email address is being protected from spambots. You need JavaScript enabled to view it.
Received:
3
December
2021
Accepted:
21
January
2022
Abstract
Context. Isolated stellar-mass black holes accrete gas from their surroundings, often at supersonic speeds, and can form outflows that may influence the accreted gas. The latter process, known as mechanical feedback, can significantly affect the accretion rate.
Aims. We use hydrodynamical simulations to assess the impact of mechanical feedback on the accretion rate when the black hole moves supersonically through a uniform medium.
Methods. We carried out three-dimensional (3D) hydrodynamical simulations of outflows fueled by accretion that interact with a uniform medium, probing scales equivalent to and larger than the accretor gravitational sphere of influence. In the simulations, the accretor is at rest and the medium moves at supersonic speeds. The outflow power is assumed to be proportional to the accretion rate. The simulations were run for different outflow-medium motion angles and velocity ratios. We also investigated the impact of different degrees of outflow collimation, accretor size, and resolution.
Results. In general, the accretion rate is significantly affected by mechanical feedback. There is a minor reduction in accretion for outflows perpendicular to the medium motion, but the reduction quickly becomes more significant for smaller angles. Moreover, the decrease in accretion becomes greater for smaller medium-to-outflow velocity ratios. On the other hand, the impact of outflow collimation seems moderate. Mechanical feedback is enhanced when the accretor size is reduced. For a population of black holes with random outflow orientations, the average accretion rate drops by (low–high resolution) ∼0.2 − 0.4 and ∼0.1 − 0.2 for medium-to-outflow velocity ratios of 1/20 and 1/100, respectively, when compared to the corresponding cases without outflow.
Conclusions. Our results strongly indicate that on the considered scales, mechanical feedback can easily reduce the energy available from supersonic accretion by at least a factor of a few. This aspect should be taken into account when studying the mechanical, thermal, and non-thermal output of isolated black holes.
Key words: black hole physics / accretion, accretion disks / ISM: jets and outflows / dark matter
© ESO 2022
1. Introduction
Wandering stellar-mass black holes that lack non-degenerate stellar companions (referred to as isolated black holes, IBH, hereafter, regardless of their multiplicity) are naturally expected to be present in the Galaxy simply based on studies of stellar evolution. The predicted numbers of these objects in the Galactic disk are as high as ∼108 (e.g., Shapiro & Teukolsky 1983) and, thus, significant numbers of IBH ought to be present in all kinds of galactic environments. In fact, the presence of IBH in the Universe has been indirectly inferred from gravitational lensing studies (e.g., Wyrzykowski et al. 2016; Karolinski & Zhu 2020; Wyrzykowski & Mandel 2020) and directly found through the detection of gravitational waves from black-hole binary mergers by the LIGO and Virgo collaborations (e.g., Abbott et al. 2016, 2021). Moreover, the presence of IBH have also been inferred through their effects on the dynamical evolution of the galactic structures in which they are embedded (see, e.g., Gieles et al. 2021, and references therein). However, despite theoretical expectations of their numbers and emission (e.g., Meszaros 1975; McDowell 1985; Campana & Pardi 1993; Fujita et al. 1998; Agol & Kamionkowski 2002; Maccarone 2005; Barkov et al. 2012; Fender et al. 2013; Ioka et al. 2017; Tsuna et al. 2018; Matsumoto et al. 2018; Tsuna & Kawanaka 2019; Kimura et al. 2021), thus far there has not been any electromagnetic radiation detected unambiguously from these objects. It is worth noting that in addition to IBHs of stellar origin, black holes of stellar masses formed in the very early universe, known as primordial black holes, may also exist (e.g., Zel’dovich & Novikov 1967; Hawking 1971; Carr & Hawking 1974; Chapline 1975). If this were the case, these objects would make up some fraction of the dark matter and could be responsible for (at least some) gravitational wave detections (e.g., Bird et al. 2016; Clesse & García-Bellido 2017; Sasaki et al. 2016, 2018; De Luca et al. 2021), leaving an imprint on the cosmic microwave background and the 21-cm Hydrogen signals (e.g., Ricotti et al. 2008; Ali-Haïmoud & Kamionkowski 2017; Poulin et al. 2017; Bernal et al. 2017, 2018; Nakama et al. 2018; Hektor et al. 2018; Mena et al. 2019; Hütsi et al. 2019) and potentially populating the Galaxy in significant numbers while emitting in different wavelengths (e.g., Gaggero et al. 2017; Manshanden et al. 2019; Bosch-Ramon & Bellomo 2020).
Regardless of their origin, IBHs accreting from the environment can launch outflows (winds, jets, or both) under very different conditions. The presence of such outflows, which may be quite common, can modulate the accretion of gas by transferring momentum and energy to the medium on the scales of the IBH gravitational sphere of influence, or even farther. This process is known as mechanical feedback and it does not require much outflow power to affect the gas far from the IBH, as even relatively weak outflows could interfere with the supersonic accretion process. In fact, few numerical studies of illustrative cases (Li et al. 2020; Bosch-Ramon & Bellomo 2020) have been done, which suggest that this interference may be rather strong. Therefore, the potential ubiquity of outflows, and a possible high efficiency of mechanical feedback, may severely reduce the energetics of IBH accretion already relatively far from the IBH. In this way, mechanical feedback would affect, for instance, the radiation produced by accretion or the outflows themselves, the potential non-thermal particle production, IBH growth, or effects on matter and radiation in the present and the early Universe (see, e.g., Soker 2016; Ioka et al. 2017; Levinson & Nakar 2018; Zeilig-Hess et al. 2019; Gruzinov et al. 2020; Li et al. 2020; Bosch-Ramon & Bellomo 2020; Takhistov et al. 2021, 2022).
It is still not clear at a quantitative level how the accretion rate depends on the outflow orientation and collimation degree, or the accretor-medium relative velocity, as a broad exploration of mechanical feedback in accreting supersonic IBH has not been undertaken thus far. Attempting to improve our understanding of the role of mechanical feedback in accreting supersonic IBHs, we performed, for the first time, a wide exploration of mechanical feedback in stellar-mass IBH through a set of numerical three-dimensional (3D) simulations, probing different outflow orientations and medium velocities, outflow opening angles, and the effect of simulation limitations such as resolution or the accretor size. We focused on the effect of mechanical feedback on the accretion rate on scales similar to or larger than the IBH sphere of influence.
The article is organized as follows. In Sect. 2, we describe the studied scenario and present a simplified analysis of mechanical feedback that helped to guide the numerical calculations. Then, the numerical simulations are introduced in Sect. 3, and their results are presented and discussed in Sects. 4 and 5, respectively. Throughout this work, the convention Qb = Q/10b is adopted, with Q given in cgs units (unless stated otherwise).
2. Physical scenario
2.1. Accretion and outflow
The scenario investigated in this work consists of an IBH surrounded by a uniform medium with velocity vIBH, which is taken well above the sound speed of the medium. The IBH produces a bipolar, axisymmetric, and accretion-powered outflow whose injection was modeled phenomenologically and located close to the IBH. We adopted a set of parameters for which the interacting flows evolve adiabatically.
The impact of the IBH outflow on the accretion rate was studied on scales similar to or larger than the sphere of influence of the IBH. This region defined around the IBH has a radius (Hoyle & Lyttleton 1939; Bondi & Hoyle 1944):
 (1)
(1)
and is much larger than the region where the outflow forms. As the outflow formation occurs much closer to the IBH, the escape velocity is expected to be ≫vIBH. Thus, the outflow velocity (vo) is also expected to be ≫vIBH.
In the absence of mechanical feedback effects, the accretion rate of a (highly) supersonic accretor can be characterized using racc via (Hoyle & Lyttleton 1939; Bondi & Hoyle 1944):
 (2)
(2)
where nm is the medium density (see, e.g., Eq. (32) in Edgar 2004, for the case with an appreciable sound speed). It is worth mentioning, as discussed in Bosch-Ramon & Bellomo (2020), that the accretion rates expected in typical scenarios are far lower than the Eddington rate, which implies that accretion takes place through a radiatively inefficient, geometrically thick in-flowing structure.
The power of each side of the bipolar outflow is linked to the accretion rate via  , where
  is the accretion rate under the effects of mechanical feedback and ϵ is a free parameter that determines the fraction of
  that goes to the bipolar outflow. We note that the power of the outflow, as it is defined, and the fact that the latter is initially highly supersonic allow for the derivation of the outflow mass rate:
  . As demonstrated in Eqs. (10) and (11) in Bosch-Ramon & Bellomo (2020), the energetic requirement for an outflow to escape the ram pressure of the in-falling material is quite modest, and we chose in this work a rather low value of 0.1 for ϵ. On the other hand, Barkov & Khangulyan (2012) showed that the efficiency in outflow production under somewhat similar conditions (i.e., low angular-momentum accretion) could be in fact as high as
  , whereas what we take here is
  . We chose a much lower (and arguably more conservative) value for this efficiency for two reasons: (1) to show that even relatively weak winds can significantly affect the accretion rate; (2) perhaps even more importantly, a modest Lo-value allows for the use of a computational grid that is significantly smaller than that needed in the case of a powerful outflow.
The outflow assumed here can still easily reach beyond racc, allowing it to directly interact hydrodynamically with material that is still not significantly affected by the IBH gravity. Through this mechanical feedback, the outflow deposits momentum and energy on the incoming medium (as seen by the IBH), thereby compressing and heating the gas and potentially reducing the accretion rate.
2.2. Relevant dependencies of mechanical feedback
Mechanical feedback effectively reduces how much medium is captured (as illustrated in Fig. 1) and the actual accretion rate,  , will be smaller than the value of ṀIBH without an outflow by a factor of:
 (3)
(3)
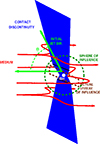 |
Fig. 1. Sketch of the scenario (not to scale). The relation between the green circumference and the smaller brown rectangle determines how much medium finally reaches the accretor. The thick red solid lines represent the medium streamlines that may or may not reach the accretor depending on their impact parameter. |
The value of ξ should mostly depend on how much energy is injected by the outflow in the incoming medium, as this would modify the effective region of influence of the IBH. The injection of energy takes place at the contact discontinuity (CD) between the medium and the outflow, mediated by the transfer of some momentum from the outflow to the medium.
The rate at which the outflow transfers momentum to the medium at the CD can be roughly estimated from the outflow momentum rate component facing the medium, which in the non-relativistic case is:
 (4)
(4)
where θ is the angle that characterizes the outflow-medium motion angle (see Fig. 1). This equation assumes that the outflow and the medium interact obliquely and that the outflow becomes subsonic at the oblique shock imparted by the medium impact, in the shock frame. For cases with θ approaching 90°, further physical information would be required for a proper estimate of ṗo⊥, as the opening angle of the outflow becomes important. On the other hand, for θ ∼ 0, the flows interact head-on and the situation would be very different.
Assuming that all the medium within racc is intercepted by the CD and shocked, the amount of energy per time transferred to the medium shocked against the CD, within a certain distance from the accretor, can be roughly characterized as:
 (5)
(5)
This extra energy, pumped into the medium by getting obliquely impacted by the outflow, can lead to a very much enhanced medium sound speed. Assuming that the mass rate entering the region of interest is  , we can estimate this sound speed via:
 (6)
(6)
After being stopped by the CD, the shocked medium is initially subsonic, and thus cs becomes a characteristic velocity of the problem. For the aim of performing numerical simulations, a heuristic approach is adopted in what follows, in which ξ is considered to be mostly a function of vIBH/cs and, thus, a function of ηv and cos θ, where ηv = vIBH/vo.
As explained above, ϵ is fixed to 0.1, which is high enough to allow the outflow to reach beyond the IBH sphere of influence (Bosch-Ramon & Bellomo 2020). This is done under the assumption that significantly larger ϵ-values would lead at least to a similar impact on the part of mechanical feedback on accretion (if not more), but a devoted study is needed for a proper, quantitative assessment. Despite the dependency of ṀIBH on MIBH is rather strong, the previous analysis allows us to neglect this parameter as the intent of this investigation is focused solely on relative comparisons. On the other hand, despite the outflow half-opening angle (χ) does not appear in Eq. (6), we studied two different values of χ in the simulations for an exploratory evaluation of its role.
We focused on cases in which the interacting flows were adiabatic, and a fortunate consequence of this assumption is that ξ is independent of nm. We did not consider conditions under which the interacting flows would evolve in the radiative regime due to the difficulties in generalizing the results in that case, as they are more difficult to scale and the computing costs are higher. Additional complex phenomena are expected to arise in the radiative regime, such as the formation of thin shocked gas shells, cooling-enhanced instabilities, enhanced interaction-structure disruption, and so on (see, e.g., Zeilig-Hess et al. 2019). Although these phenomena would likely yield quantitative differences in the effect of mechanical feedback with respect to the adiabatic case, their study has been set aside for a future work. A related caveat is that without radiative cooling, accretion can be halted by pure adiabatic compression when the accreted gas becomes too hot close enough to the IBH. In our case, given the relatively large accretor sizes considered, this effect is not significant. In a way, this effect is included here by assuming the presence of an outflow, as the latter can be produced in the vicinity of an IBH precisely due to an excess of thermal energy (e.g., Sdowski et al. 2016).
In the next sections, we explore numerically how accretion is affected by an outflow accounting for changes in θ and ηv. Two different resolutions are also adopted, with the higher resolution being twice the lower one, allowing for the study of cases with half the outflow half-opening angle and accretor size.
3. Simulations
The simulations done for this work were carried out in 3D, which allowed for the exploration of a much broader parameter space than that studied in the 2D simulations of Bosch-Ramon & Bellomo (2020). Since the adopted vo is ≪c, the performed numerical calculations solved the non-relativistic equations of hydrodynamics in Cartesian coordinates for the conservation of mass, momentum, and energy, using a code based on a finite-difference scheme that is of the third order in space and second order in time. For simplicity, the simulated flows were assumed to be one-species, non-relativistic ideal gases that evolve adiabatically, with gas adiabatic index  . We adopted the same Riemann solver and spatial discretization scheme as in Bosch-Ramon & Bellomo (2020): the Marquina flux formula (Donat & Marquina 1996) and the PPM method, as presented in Mignone et al. (2005), respectively. For further details on the code employed, we refer to de la Cita et al. (2017) and references therein. The employed code is parallelized through OpenMP, and the calculations were done in a work station using ten processors. The computing time devoted to all the performed simulations was ∼2 × 10⁴ CPU hours.
The accretor was simulated as a quasi-spherical region in the computational grid with pressure and density much lower than in the surroundings, within which the material is forced to move radially inwards at the local free-fall velocity. The accretor gravitational force was introduced in the hydrodynamical equations as a source term (see, e.g., Toro 2009). Through the poles of that spherical region, a radial outflow symmetric around the  -direction enters into the simulation region with half-opening angle, χ, a velocity of vo = 109 cm s−1, and Mach number ≈8. The Mach number is high enough to mimic the evolution of a flow that is cold, as expected that far from the outflow launching region. Since the outflow is initially in overpressure with the surroundings, its Mach number increases further outside the outflow inlet. The value of χ was set to 0.4 (radians; i.e., ≈23°) in all simulation runs but in one case, in which a χ-value of 0.2 was adopted to probe the effects of a more collimated outflow. Initially, in all simulations, outside the accretor the medium initial density is ρm = nmmH = mH g cm−3, where mH ≈ 1.7 × 10⁻²⁴ g is the Hydrogen atom mass. Two different initial medium velocities were studied: vIBH = 107 and 5 × 107 cm s−1, with a Mach number of 3. The grid boundary conditions were set to in-flow at the boundaries where the medium entered the computational domain, reflection at y = 0, and free-flow in the remaining boundaries.
The gravitational force of the IBH was modeled as generated by a point-like object with mass MIBH = 30 M⊙ located at (0, 0, 0). The sphere of influence of such an object has a radius racc ≈ 3 × 1012 cm for vIBH = 5 × 107 cm s−1, and ≈8 × 1013 cm for vIBH = 107 cm s−1 (see Eq. (1)). The corresponding accretion timescales are tacc = racc/vIBH ≈ 6.4 × 10⁴ s and ≈8 × 10⁶ s for vIBH = 5 × 107 cm s−1 and vIBH = 107 cm s−1, respectively.
3.1. Studied cases
For the simulations with vIBH = 5 × 107 cm s−1 and low resolution (called reference cases), the considered values of θ were 90°, 60°, 45°, 30°, and 0°, whereas for vIBH = 107 cm s−1, they were 90°, 45°, and 0°. For vIBH = 5 × 107 cm s−1 and θ = 60° and 45°, runs were carried out with twice the resolution of the reference cases, and additionally for θ = 60°, two different accretor sizes and χ-values were explored. All the listed parameter configurations are presented in Table 1.
(Free) parameter values used in the simulations.
In addition to the simulations of the described cases, several test trials were run to check the robustness of the simulations, in particular for runs with the longest computing times. For instance, the simulations with vIBH = 107 cm s−1 were approximately ∼20 times longer than the corresponding reference cases, which made difficult to use large grids. Therefore, the behavior of  was checked with relatively shorter simulations involving larger grids and ≈2/3 of the resolution. This was done for comparison for the cases with θ = 45° and vIBH = 107 cm s−1 as well as vIBH = 5 × 107 cm s−1 and, for completeness, for the cases with vIBH = 107 cm s−1 and θ = 30° and 60° (to probe a slightly different region of the parameter space). These test results yielded quite similar results (not shown here) to those obtained in the main simulations, giving us confidence on the soundness of the numerical solutions, particularly regarding the accretor, outflow inlet, and grid sizes.
3.2. Computational grid
The computational grid is inhomogeneous. In the low-resolution runs, the sphere of influence has a radius of ∼30 cells, and the accretor region radius is 10 cells. In the high-resolution runs, the sphere of influence has a radius of ∼60 cells and the accretor radii are 10 or 20 cells, depending on the studied case. A ratio of accretor radius to racc (ℛ; see Table. 1) of 1/3 is not optimal for accuracy, but is enough for semi-quantitative estimates and was generally adopted because it allowed us to run a larger number of simulations. Taking ℛ = 1/6 yields more accurate results as long as the accretor is reasonably resolved (∼10 cells seemed to work well enough for our purposes); Bosch-Ramon & Bellomo (2020) found a reasonable level of convergence around ℛ ≈ 1/6, whereas Zeilig-Hess et al. (2019) found an error of ≈10% for ℛ = 1/10 in their accretion test calculations. In the high- (low-) resolution runs, an accretor radius of 10 cells yields ℛ = 1/6 (1/3). The minimum χ was set such that the outflow diameter at injection was ≈8 cells, which was the case in all the simulations except the one with high resolution and ℛ = 1/3, for which it was ≈16 cells. An accretor radius of 20 (10) cells and minimum outflow diameter of 8 cells allowed a minimum χ of 0.2 (0.4). Systematic errors for an outflow inlet with radius ≈8 cells are expected to be of ∼10% in the outflow mass, momentum, and energy rates, sufficient for the intended level of approximation.
For the reference cases, the whole computational grid consists of 200 × 100 × 200 (Nx × Ny × Nz) cells, ranging from x, z ≈ −8.3 to 8.3 racc, and from y = 0 to 8.3 racc; a run without outflow was also done with z > 0 and the upper half of the volume. The grid includes a uniform region centered at (0, 0, 0) with volume 20 × 10 × 20 ( ) cubic cells with size
  , fully encompassing the accretor and the outflow inlet.
In the runs with vIBH = 107 cm s−1, the grid ranges from x ≈ −2.5 to 17.5 racc, from y = 0 to 8.75 racc, and from z ≈ −17.5 to 17.5 racc. The uniform grid has the same  ,
,  ,
,  values as in the case with vIBH = 5 × 107 cm s−1, whereas now Nx = 190, Ny = 100, and Nz = 270.
In the high-resolution simulations, vIBH was again set to 5 × 107 cm s−1, and two values for θ, 60° and 45°, were considered. The grid now ranges from x, z ≈ −6.75 to 6.75 racc, and from y = 0 to 6.75 racc. The whole grid has Nx = 260, Ny = 130 and Nz = 260, and the central uniform region has  ,
,  , and
, and  , and is made of cubic cells with
  . In the case with θ = 60°, three different cases were studied probing different accretor sizes and outflow opening angles: ℛ = 1/3 (χ = 0.4) and 1/6 (χ = 0.4) and χ = 0.2 (ℛ = 1/3). In the case with θ = 45°, the parameter values were the same as in the corresponding reference case, but with ℛ, now set to 1/6.
The non-uniform grid region is made of cells expanding at a fix rate of 1.019 per spatial step, starting beyond cell  ,
,  , and
, and  independently in each direction. To avoid numerical artifacts, the cell aspect ratio was kept below ∼10 in the whole grid (Perucho et al. 2005), and the maximum aspect ratio was only achieved at the most peripheric grid regions. The information on the number of cells for the uniform and the whole grid in each simulation is given in Table 2.
Number of cells for the whole grid and for the uniform grid region.
The value of  was computed two cells farther from the accretor boundary in all cases but in the high-resolution case with ℛ = 1/3, for which it was four cells. We recall here that the power of each component of the bipolar outflow is related to
  via
via  . Given that vo = 109 cm s−1, we may alternatively write
  , which indicates that the adopted outflow power is rather small when compared to what is potentially available close to the IBH event horizon, on the order of
  (see Barkov & Khangulyan 2012, and references therein).
4. Results
We show in Figs. 2–7 the density maps for the reference cases at the end of the runs (time tsim), in the y = 0 and z = 0 planes and with no outflow case included. The computation time, tsim, was chosen such that the simulations were run until they reached a quasi-steady (QS) state. This means that they ran long enough for the shocked external medium (the slowest flow in the simulation) to cross the whole grid and for the accretion rate to show a repetitive pattern. The evolution of  for the reference cases is shown in Fig. 8. As seen from the figures, the interaction structure becomes more unstable; and the typical
  decreases proportionally to the decreasing value of θ, that is, as the medium-outflow interaction grows more direct. This result confirms what was already indicated in the simulations of Li et al. (2020) and also suggested by Bosch-Ramon & Bellomo (2020) regarding the θ-dependence of mechanical feedback. Averaging the QS-state
  in solid angle, we obtain an averaged ratio of
  over the numerical accretion rate without outflow (
 ) of:
) of:
 (7)
(7)
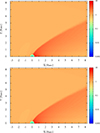 |
Fig. 2. Density map on the y = 0 (top panel) and z = 0 planes (bottom panel) in the case without outflow, at tsim ≈ 23 tacc. The initial medium velocity and density are 5 × 107 cm s−1 and 1.7 × 10⁻²⁴ cm−3, respectively, and ℛ = 1/3 and MIBH = 30 M⊙. The axis units are racc ≈ 3 × 1012 cm, and the color scale is normalized to the initial medium density. |
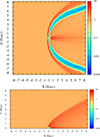 |
Fig. 3. Density map on the y = 0 (top panel) and z = 0 planes (bottom panel) for an outflow with χ = 0.4 and θ = 90°, at tsim ≈ 23 tacc. The initial medium velocity is 5 × 107 cm s−1, and ℛ = 1/3. The axis units are racc ≈ 3 × 1012 cm. |
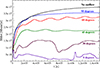 |
Fig. 8. Accretion rate for the reference cases (from top to bottom): without outflow and with outflow and θ = 90° (perpendicular medium and outflow), 60°, 45°, 30°, and 0° (parallel medium and outflow). The results are for simulation times up to tsim ≈ 23 tacc, where tacc ≈ 6.4 × 10⁴ s. |
Figure 9 presents the density maps in the y = 0 and z = 0 planes for θ = 45° and vIBH = 107 cm s−1, and the same cell size in units of racc as in the reference cases. For this intermediate θ-value, the interaction structure is mostly filled with shocked outflow material, whereas in the corresponding reference case, it was mostly filled by shocked medium material. The structure seems more unstable as well when it is far from the IBH sphere of influence. Density maps for the cases with θ = 90° and 0° are not shown as they resemble the corresponding reference cases. Figure 10 shows the evolution of  for the three θ-values, which is more affected by mechanical feedback than in the reference cases, whereas the level of stability of the accretion curves is similar. For this lower vIBH-value, the value of ⟨ξnum⟩ approaches ∼0.2 using this poorer sample of θ-values (although it is consistent with the value derived from the mentioned test trials with lower resolution). This result indicates that the lower the value of vIBH, the stronger the effect of mechanical feedback on the IBH accretion rate.
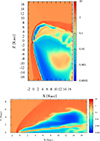 |
Fig. 9. Density map on the y = 0 (top panel) and z = 0 planes (bottom panel) for χ = 0.4, ℛ = 1/3 and θ = 45°, at tsim ≈ 75 tacc. The initial medium velocity is 107 cm s−1, and the axis units racc ≈ 8 × 1013 cm. |
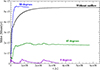 |
Fig. 10. Accretion rate for vIBH = 107 cm −1 and θ = 90° (blue solid line), θ = 45° (green solid line) and θ = 0° (violet solid line). The case without outflow is also shown (black solid line). We remind that in these simulations tacc ≈ 8 × 10⁶ s. |
Figures 11–13 show density maps in the y = 0 and z = 0 planes for θ = 60°, again with vIBH = 5 × 107 cm s−1, but now with twice the resolution of the reference cases. Two accretor sizes (ℛ = 1/6 and 1/3, as in Figs. 11 and 13) fixing χ = 0.4, and outflow half-opening angles (χ = 0.2 and 0.4, as in Figs. 12 and 13) fixing ℛ = 1/6, were explored. Figure 14 shows the evolution of  for these three cases and the corresponding reference case. Figure 15 presents the same as Fig. 11 (vIBH = 5 × 107 cm s−1, ℛ = 1/6 and χ = 0.4), but now for θ = 45° and only the y = 0 plane. To illustrate the variability of the structure in the QS state, stronger than in the corresponding reference case, this figure shows three different simulation times towards tsim ≈ 23 tacc, each separated by ≈tacc. The evolution of
  for this case and for the corresponding reference case is shown in Fig. 16. The accretion curves of θ = 60° and 45° do not reflect a higher variability of
  in the high-resolution cases when compared to the reference ones.
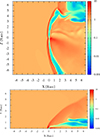 |
Fig. 11. Density map on the y = 0 (top panel) and z = 0 planes (bottom panel) for χ = 0.4, ℛ = 1/6, and θ = 60°, at tsim ≈ 12 tacc in the high-resolution case. The initial medium velocity is 5 × 107 cm s−1, and the axis units racc ≈ 3 × 1012 cm. |
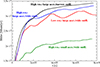 |
Fig. 14. Accretion rate for vIBH = 5 × 107 cm −1 and θ = 60° in the high-resolution cases with ℛ = 1/3 and χ = 0.2 (black solid line), ℛ = 1/3 and χ = 0.4 (blue solid line), and ℛ = 1/6 and χ = 0.4 (green solid line). The value of tsim is ≈12 tacc. The reference case with the same θ is also shown (red solid line). |
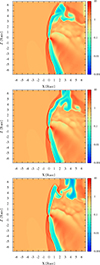 |
Fig. 15. Same as in Fig. 11 but for θ = 45° and only the y = 0 plane at three different times: ≈21 (top panel), 22 (middle panel), and 23 tacc (bottom panel). |
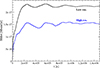 |
Fig. 16. Same as in Fig. 14 but for θ = 45°, and χ = 0.4 and ℛ = 1/6, with tsim ≈ 23 tacc (blue solid line). The reference case (low-resolution) for the same θ-value is also shown (black solid line). |
The high-resolution simulations show that increasing the resolution by a factor of 2, while keeping the accretor size and the outflow opening angle equal, yields similar results to the low-resolution simulations. On the other hand, making the resolution twice higher, while keeping the accretor size and reducing the outflow half-opening angle by half, somewhat reduces the impact of mechanical feedback, hinting at a moderate impact of χ on this effect; we note that for χ ≳ 1, the results are expected to be closer to the case with θ = 0. However, the most prominent result is that increasing the resolution by a factor of 2, while keeping χ = 0.4 and decreasing the accretor size to a half, reduces the predicted QS-state accretion rate by ≈33%.
We conclude this section with some illustrative plots that summarize the obtained results. We represent the typical accretion rate versus θ-value for the reference cases in the QS state, and the result is shown in Fig. 17. The figure indicates that the stronger θ-dependence of  is found at intermediate θ-values. In Fig. 18, we present the typical accretion rate versus vIBH at θ = 0°, 45° and without outflow (very similar to the 90° case) in the QS state. In that figure, the slopes of a log-log representation of the lines are also given to better visualize the difference in behavior between the cases with outflow and the case without. The slopes seem to indicate that the vIBH-dependence of
  weakens somewhat when the outflow is present. It is also worth noting that the case without outflow, with slope −3.1, is as expected pretty close to the analytical value of −3 (see Eq. (2)). Finally, in Fig. 19 we show the typical accretion rate versus degree of resolution (low and high) for vIBH = 5 × 107 cm s−1 and θ = 45° (ℛ = 1/6, χ = 0.4) and 60° (ℛ = 1/3, χ = 0.2; ℛ = 1/3, χ = 0.4; ℛ = 1/6, χ = 0.4), at tsim ≈ 12 tacc. As noted in the text, the stronger effect on
  arises when the accretor radius is smaller, whereas the effect is similar for both θ-angles.
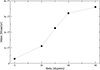 |
Fig. 17. Typical accretion rate versus θ-value for the reference cases in the QS state. |
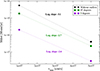 |
Fig. 18. Typical accretion rate versus vIBH at θ = 0°, 45° and without outflow in the QS state. The slopes of a log-log representation of the lines are also given. |
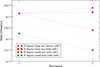 |
Fig. 19. Typical accretion rate versus degree of resolution (in the horizontal axis, 1: low; 2: high) for vIBH = 5 × 107 cm s−1 and θ = 45° (ℛ = 1/6, χ = 0.4) and 60° (ℛ = 1/3, χ = 0.2; ℛ = 1/3, χ = 0.4; ℛ = 1/6, χ = 0.4), at tsim ≈ 12 tacc. |
5. Summary and discussion
The results presented in this work demonstrate that the presence of outflows, either winds or jets, can easily interfere with supersonic accretion through mechanical feedback on the scales of the IBH sphere of influence. As expected from the analysis described in Sect. 2, the results confirm that both θ and vIBH have a significant impact on the accretion rate. The low-resolution simulations allow us to predict that a population of IBH with a random distribution of outflow orientations and directions of motion will present a decrease in the averaged  over
over  of ⟨ξnum⟩∼0.4 and 0.2 for ηv-values of 1/20 and 1/100, respectively. However, the impact of resolution cannot be neglected. As shown by the high-resolution simulations with ℛ = 1/6, which probed cases with θ = 60° and 45° and vIBH = 5 × 107 cm s−1, ξnum decreases by ≈33% with respect to the corresponding reference cases for both θ-values. Thus, if this resolution effect could be generalized to other θ- and ηv-values, our results would predict even lower values for ⟨ξnum⟩, of ∼0.2 − 0.3 and ∼0.1 − 0.2 for ηv-values of 1/20 and 1/100, respectively. It is worth noting that if the medium were inhomogeneous on spatial scales ≲racc, fast variations in the accreted angular momentum and magnetic field geometry may lead to IBH outflows changing direction on timescales ≲tacc. This could lead to some degree of isotropization of the outflow effect on the medium, in which case ξ would likely become smaller. Moreover, if instead of a sole IBH, the accretor would consist of more than one object, several outflows with different orientations could form, which again may reduce ξ.
The mechanical feedback process described in this work, which has such a significant impact on scales ∼racc is usually not considered when estimating the mechanical and radiative outputs of IBH (see however, e.g., Ioka et al. 2017; Matsumoto et al. 2018; Takhistov et al. 2021, 2022, where mechanical feedback is discussed). If outflows with enough momentum and power to reach beyond racc from the IBH are present (which does not require much Lo), mechanical feedback should affect the impact of supersonic IBHs on the environment, and their detectability via electromagnetic radiation. An accurate evaluation of the impact of mechanical feedback, case by case, or population-wise, would require us to account for many factors the assessment of which is outside the scope of this work, in particular: mass, spatial, and velocity distribution of IBH; the medium density structure; the outflow production efficiency and velocity, and (though less significant) half-opening angle. Nevertheless, despite a drop in  by a factor of several may seem rather minor in front of so many uncertainties, mechanical feedback cannot be neglected, as such a drop in
  appears to be a sound prediction that goes against IBH detectability.
We conclude this work by noting that our results seem robust in their range of applicability, paving the way for simulations with higher resolution, with larger grids and longer durations, which should be carried out as a next step for even more general predictions. The reasons behind this include: the fact that increasing the resolution further would allow for the exploration of smaller values of ℛ and χ; enlarging the grid would allow the adoption of even lower ηv-values, or larger ϵ-values; and more resourceful simulations would permit the study of relativistic effects by adopting vo-values closer to c without increasing vIBH to compensate (see Bosch-Ramon & Bellomo 2020, for a dicussion on the impact of ηv on the computing time). These simulations should be carried out in a supercomputing facility with a code allowing for MPI-parallelization. In addition to all these improvements, we must nevertheless indicate that the mode of accretion and outflow generation depends on the accretion rate in a complex way, with narrow jets and broad winds alternatively dominating the outflows depending on the accretion regime (Bosch-Ramon & Bellomo 2020). Therefore, as accretion-ejection phenomena occur in the IBH vicinity, the study of mechanical feedback should also eventually account for the physics on spatial scales of both ∼ and ≪racc.
Acknowledgments
We thank the anonymous referee for constructive and useful comments that helped to improve the manuscript. V.B-R. acknowledges financial support from the State Agency for Research of the Spanish Ministry of Science and Innovation under grant PID2019-105510GB-C31 and through the “Unit of Excellence María de Maeztu 2020-2023” award to the Institute of Cosmos Sciences (CEX2019-000918-M). V.B-R. is Correspondent Researcher of CONICET, Argentina, at the IAR.
References
- Abbott, B. P., Abbott, R., Abbott, T. D., et al. 2016, Phys. Rev. Lett., 116, 061102 [Google Scholar]
- Abbott, R., Abbott, T. D., Abraham, S., et al. 2021, ApJ, 913, L7 [NASA ADS] [CrossRef] [Google Scholar]
- Agol, E., & Kamionkowski, M. 2002, MNRAS, 334, 553 [NASA ADS] [CrossRef] [Google Scholar]
- Ali-Haïmoud, Y., & Kamionkowski, M. 2017, Phys. Rev. D, 95, 043534 [CrossRef] [Google Scholar]
- Barkov, M. V., & Khangulyan, D. V. 2012, MNRAS, 421, 1351 [NASA ADS] [CrossRef] [Google Scholar]
- Barkov, M. V., Khangulyan, D. V., & Popov, S. B. 2012, MNRAS, 427, 589 [NASA ADS] [CrossRef] [Google Scholar]
- Bernal, J. L., Bellomo, N., Raccanelli, A., & Verde, L. 2017, JCAP, 2017, 052 [CrossRef] [Google Scholar]
- Bernal, J. L., Raccanelli, A., Verde, L., & Silk, J. 2018, JCAP, 2018, 017 [CrossRef] [Google Scholar]
- Bird, S., Cholis, I., Muñoz, J. B., et al. 2016, Phys. Rev. Lett., 116, 201301 [NASA ADS] [CrossRef] [Google Scholar]
- Bondi, H., & Hoyle, F. 1944, MNRAS, 104, 273 [Google Scholar]
- Bosch-Ramon, V., & Bellomo, N. 2020, A&A, 638, A132 [NASA ADS] [CrossRef] [EDP Sciences] [Google Scholar]
- Campana, S., & Pardi, M. C. 1993, A&A, 277, 477 [NASA ADS] [Google Scholar]
- Carr, B. J., & Hawking, S. W. 1974, MNRAS, 168, 399 [NASA ADS] [CrossRef] [Google Scholar]
- Chapline, G. F. 1975, Nature, 253, 251 [NASA ADS] [CrossRef] [Google Scholar]
- Clesse, S., & García-Bellido, J. 2017, Phys. Dark Universe, 15, 142 [NASA ADS] [CrossRef] [Google Scholar]
- de la Cita, V. M., del Palacio, S., Bosch-Ramon, V., et al. 2017, A&A, 604, A39 [NASA ADS] [CrossRef] [EDP Sciences] [Google Scholar]
- De Luca, V., Franciolini, G., Pani, P., & Riotto, A. 2021, JCAP, 2021, 003 [CrossRef] [Google Scholar]
- Donat, R., & Marquina, A. 1996, J. Comput. Phys., 125, 42 [NASA ADS] [CrossRef] [Google Scholar]
- Edgar, R. 2004, New Astron. Rev., 48, 843 [CrossRef] [Google Scholar]
- Fender, R. P., Maccarone, T. J., & Heywood, I. 2013, MNRAS, 430, 1538 [NASA ADS] [CrossRef] [Google Scholar]
- Fujita, Y., Inoue, S., Nakamura, T., Manmoto, T., & Nakamura, K. E. 1998, ApJ, 495, L85 [NASA ADS] [CrossRef] [Google Scholar]
- Gaggero, D., Bertone, G., Calore, F., et al. 2017, Phys. Rev. Lett., 118, 241101 [NASA ADS] [CrossRef] [Google Scholar]
- Gieles, M., Erkal, D., Antonini, F., Balbinot, E., & Peñarrubia, J. 2021, Nat. Astron., 5, 957 [NASA ADS] [CrossRef] [Google Scholar]
- Gruzinov, A., Levin, Y., & Matzner, C. D. 2020, MNRAS, 492, 2755 [NASA ADS] [CrossRef] [Google Scholar]
- Hawking, S. 1971, MNRAS, 152, 75 [Google Scholar]
- Hektor, A., Hütsi, G., & Raidal, M. 2018, A&A, 618, A139 [NASA ADS] [CrossRef] [EDP Sciences] [Google Scholar]
- Hoyle, F., & Lyttleton, R. A. 1939, Math. Proc. Cambridge Phil. Soc., 35, 405 [NASA ADS] [CrossRef] [Google Scholar]
- Hütsi, G., Raidal, M., & Veermäe, H. 2019, Phys. Rev. D, 100, 083016 [CrossRef] [Google Scholar]
- Ioka, K., Matsumoto, T., Teraki, Y., Kashiyama, K., & Murase, K. 2017, MNRAS, 470, 3332 [NASA ADS] [CrossRef] [Google Scholar]
- Karolinski, N., & Zhu, W. 2020, MNRAS, 498, L25 [NASA ADS] [CrossRef] [Google Scholar]
- Kimura, S. S., Kashiyama, K., & Hotokezaka, K. 2021, ApJ, 922, L15 [NASA ADS] [CrossRef] [Google Scholar]
- Levinson, A., & Nakar, E. 2018, MNRAS, 473, 2673 [NASA ADS] [CrossRef] [Google Scholar]
- Li, X., Chang, P., Levin, Y., Matzner, C. D., & Armitage, P. J. 2020, MNRAS, 494, 2327 [NASA ADS] [CrossRef] [Google Scholar]
- Maccarone, T. J. 2005, MNRAS, 360, L30 [NASA ADS] [CrossRef] [Google Scholar]
- Manshanden, J., Gaggero, D., Bertone, G., Connors, R. M. T., & Ricotti, M. 2019, JCAP, 2019, 026 [CrossRef] [Google Scholar]
- Matsumoto, T., Teraki, Y., & Ioka, K. 2018, MNRAS, 475, 1251 [NASA ADS] [CrossRef] [Google Scholar]
- McDowell, J. 1985, MNRAS, 217, 77 [NASA ADS] [CrossRef] [Google Scholar]
- Mena, O., Palomares-Ruiz, S., Villanueva-Domingo, P., & Witte, S. J. 2019, Phys. Rev. D, 100, 043540 [NASA ADS] [CrossRef] [Google Scholar]
- Meszaros, P. 1975, A&A, 44, 59 [NASA ADS] [Google Scholar]
- Mignone, A., Plewa, T., & Bodo, G. 2005, ApJ, 160, 199 [NASA ADS] [Google Scholar]
- Nakama, T., Carr, B., & Silk, J. 2018, Phys. Rev. D, 97, 043525 [NASA ADS] [CrossRef] [Google Scholar]
- Perucho, M., Martí, J. M., & Hanasz, M. 2005, A&A, 443, 863 [NASA ADS] [CrossRef] [EDP Sciences] [Google Scholar]
- Poulin, V., Serpico, P. D., Calore, F., Clesse, S., & Kohri, K. 2017, Phys. Rev. D, 96, 083524 [NASA ADS] [CrossRef] [Google Scholar]
- Ricotti, M., Ostriker, J. P., & Mack, K. J. 2008, ApJ, 680, 829 [NASA ADS] [CrossRef] [Google Scholar]
- Sasaki, M., Suyama, T., Tanaka, T., & Yokoyama, S. 2016, Phys. Rev. Lett., 117, 061101 [NASA ADS] [CrossRef] [Google Scholar]
- Sasaki, M., Suyama, T., Tanaka, T., & Yokoyama, S. 2018, CQG, 35, 063001 [NASA ADS] [CrossRef] [Google Scholar]
- Sdowski, A., Lasota, J. P., Abramowicz, M. A., & Narayan, R. 2016, MNRAS, 456, 3915 [CrossRef] [Google Scholar]
- Shapiro, S. L., & Teukolsky, S. A. 1983, Black Holes, White Dwarfs, and Neutron Stars: The Physics of Compact Objects (New York: Wiley) [CrossRef] [Google Scholar]
- Soker, N. 2016, New Astron. Rev., 75, 1 [CrossRef] [Google Scholar]
- Takhistov, V., Lu, P., Murase, K., Inoue, Y., & Gelmini, G. B. 2021, ArXiv e-prints [arXiv:2111.08699] [Google Scholar]
- Takhistov, V., Lu, P., Gelmini, G. B., et al. 2022, J. Cosmol. Astropart. Phys., 2022, 017 [Google Scholar]
- Toro, E. 2009, Riemann Solvers and Numerical Methods for Fluid Dynamics, 163 [CrossRef] [Google Scholar]
- Tsuna, D., & Kawanaka, N. 2019, MNRAS, 488, 2099 [NASA ADS] [CrossRef] [Google Scholar]
- Tsuna, D., Kawanaka, N., & Totani, T. 2018, MNRAS, 477, 791 [NASA ADS] [CrossRef] [Google Scholar]
- Wyrzykowski, Ł., & Mandel, I. 2020, A&A, 636, A20 [NASA ADS] [CrossRef] [EDP Sciences] [Google Scholar]
- Wyrzykowski, Ł., Kostrzewa-Rutkowska, Z., Skowron, J., et al. 2016, MNRAS, 458, 3012 [NASA ADS] [CrossRef] [Google Scholar]
- Zeilig-Hess, M., Levinson, A., & Nakar, E. 2019, MNRAS, 482, 4642 [NASA ADS] [CrossRef] [Google Scholar]
- Zel’dovich, Y. B., & Novikov, I. D. 1967, Sov. Astron., 10, 602 [Google Scholar]
All Tables
All Figures
|
Fig. 1. Sketch of the scenario (not to scale). The relation between the green circumference and the smaller brown rectangle determines how much medium finally reaches the accretor. The thick red solid lines represent the medium streamlines that may or may not reach the accretor depending on their impact parameter. |
| In the text | |
|
Fig. 2. Density map on the y = 0 (top panel) and z = 0 planes (bottom panel) in the case without outflow, at tsim ≈ 23 tacc. The initial medium velocity and density are 5 × 107 cm s−1 and 1.7 × 10⁻²⁴ cm−3, respectively, and ℛ = 1/3 and MIBH = 30 M⊙. The axis units are racc ≈ 3 × 1012 cm, and the color scale is normalized to the initial medium density. |
| In the text | |
|
Fig. 3. Density map on the y = 0 (top panel) and z = 0 planes (bottom panel) for an outflow with χ = 0.4 and θ = 90°, at tsim ≈ 23 tacc. The initial medium velocity is 5 × 107 cm s−1, and ℛ = 1/3. The axis units are racc ≈ 3 × 1012 cm. |
| In the text | |
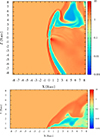 |
Fig. 4. Same as in Fig. 3 but for θ = 60°. |
| In the text | |
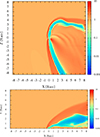 |
Fig. 5. Same as in Fig. 3 but for θ = 45°. |
| In the text | |
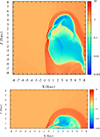 |
Fig. 6. Same as in Fig. 3 but for θ = 30°. |
| In the text | |
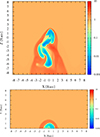 |
Fig. 7. Same as in Fig. 3 but for θ = 0°. |
| In the text | |
|
Fig. 8. Accretion rate for the reference cases (from top to bottom): without outflow and with outflow and θ = 90° (perpendicular medium and outflow), 60°, 45°, 30°, and 0° (parallel medium and outflow). The results are for simulation times up to tsim ≈ 23 tacc, where tacc ≈ 6.4 × 10⁴ s. |
| In the text | |
|
Fig. 9. Density map on the y = 0 (top panel) and z = 0 planes (bottom panel) for χ = 0.4, ℛ = 1/3 and θ = 45°, at tsim ≈ 75 tacc. The initial medium velocity is 107 cm s−1, and the axis units racc ≈ 8 × 1013 cm. |
| In the text | |
|
Fig. 10. Accretion rate for vIBH = 107 cm −1 and θ = 90° (blue solid line), θ = 45° (green solid line) and θ = 0° (violet solid line). The case without outflow is also shown (black solid line). We remind that in these simulations tacc ≈ 8 × 10⁶ s. |
| In the text | |
|
Fig. 11. Density map on the y = 0 (top panel) and z = 0 planes (bottom panel) for χ = 0.4, ℛ = 1/6, and θ = 60°, at tsim ≈ 12 tacc in the high-resolution case. The initial medium velocity is 5 × 107 cm s−1, and the axis units racc ≈ 3 × 1012 cm. |
| In the text | |
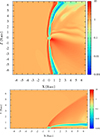 |
Fig. 12. Same as in Fig. 11 but for ℛ = 1/3 and χ = 0.2. |
| In the text | |
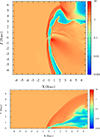 |
Fig. 13. Same as in Fig. 11 but for ℛ = 1/3 and χ = 0.4. |
| In the text | |
|
Fig. 14. Accretion rate for vIBH = 5 × 107 cm −1 and θ = 60° in the high-resolution cases with ℛ = 1/3 and χ = 0.2 (black solid line), ℛ = 1/3 and χ = 0.4 (blue solid line), and ℛ = 1/6 and χ = 0.4 (green solid line). The value of tsim is ≈12 tacc. The reference case with the same θ is also shown (red solid line). |
| In the text | |
|
Fig. 15. Same as in Fig. 11 but for θ = 45° and only the y = 0 plane at three different times: ≈21 (top panel), 22 (middle panel), and 23 tacc (bottom panel). |
| In the text | |
|
Fig. 16. Same as in Fig. 14 but for θ = 45°, and χ = 0.4 and ℛ = 1/6, with tsim ≈ 23 tacc (blue solid line). The reference case (low-resolution) for the same θ-value is also shown (black solid line). |
| In the text | |
|
Fig. 17. Typical accretion rate versus θ-value for the reference cases in the QS state. |
| In the text | |
|
Fig. 18. Typical accretion rate versus vIBH at θ = 0°, 45° and without outflow in the QS state. The slopes of a log-log representation of the lines are also given. |
| In the text | |
|
Fig. 19. Typical accretion rate versus degree of resolution (in the horizontal axis, 1: low; 2: high) for vIBH = 5 × 107 cm s−1 and θ = 45° (ℛ = 1/6, χ = 0.4) and 60° (ℛ = 1/3, χ = 0.2; ℛ = 1/3, χ = 0.4; ℛ = 1/6, χ = 0.4), at tsim ≈ 12 tacc. |
| In the text | |
Current usage metrics show cumulative count of Article Views (full-text article views including HTML views, PDF and ePub downloads, according to the available data) and Abstracts Views on Vision4Press platform.
Data correspond to usage on the plateform after 2015. The current usage metrics is available 48-96 hours after online publication and is updated daily on week days.
Initial download of the metrics may take a while.