Fig. 1.
Download original image
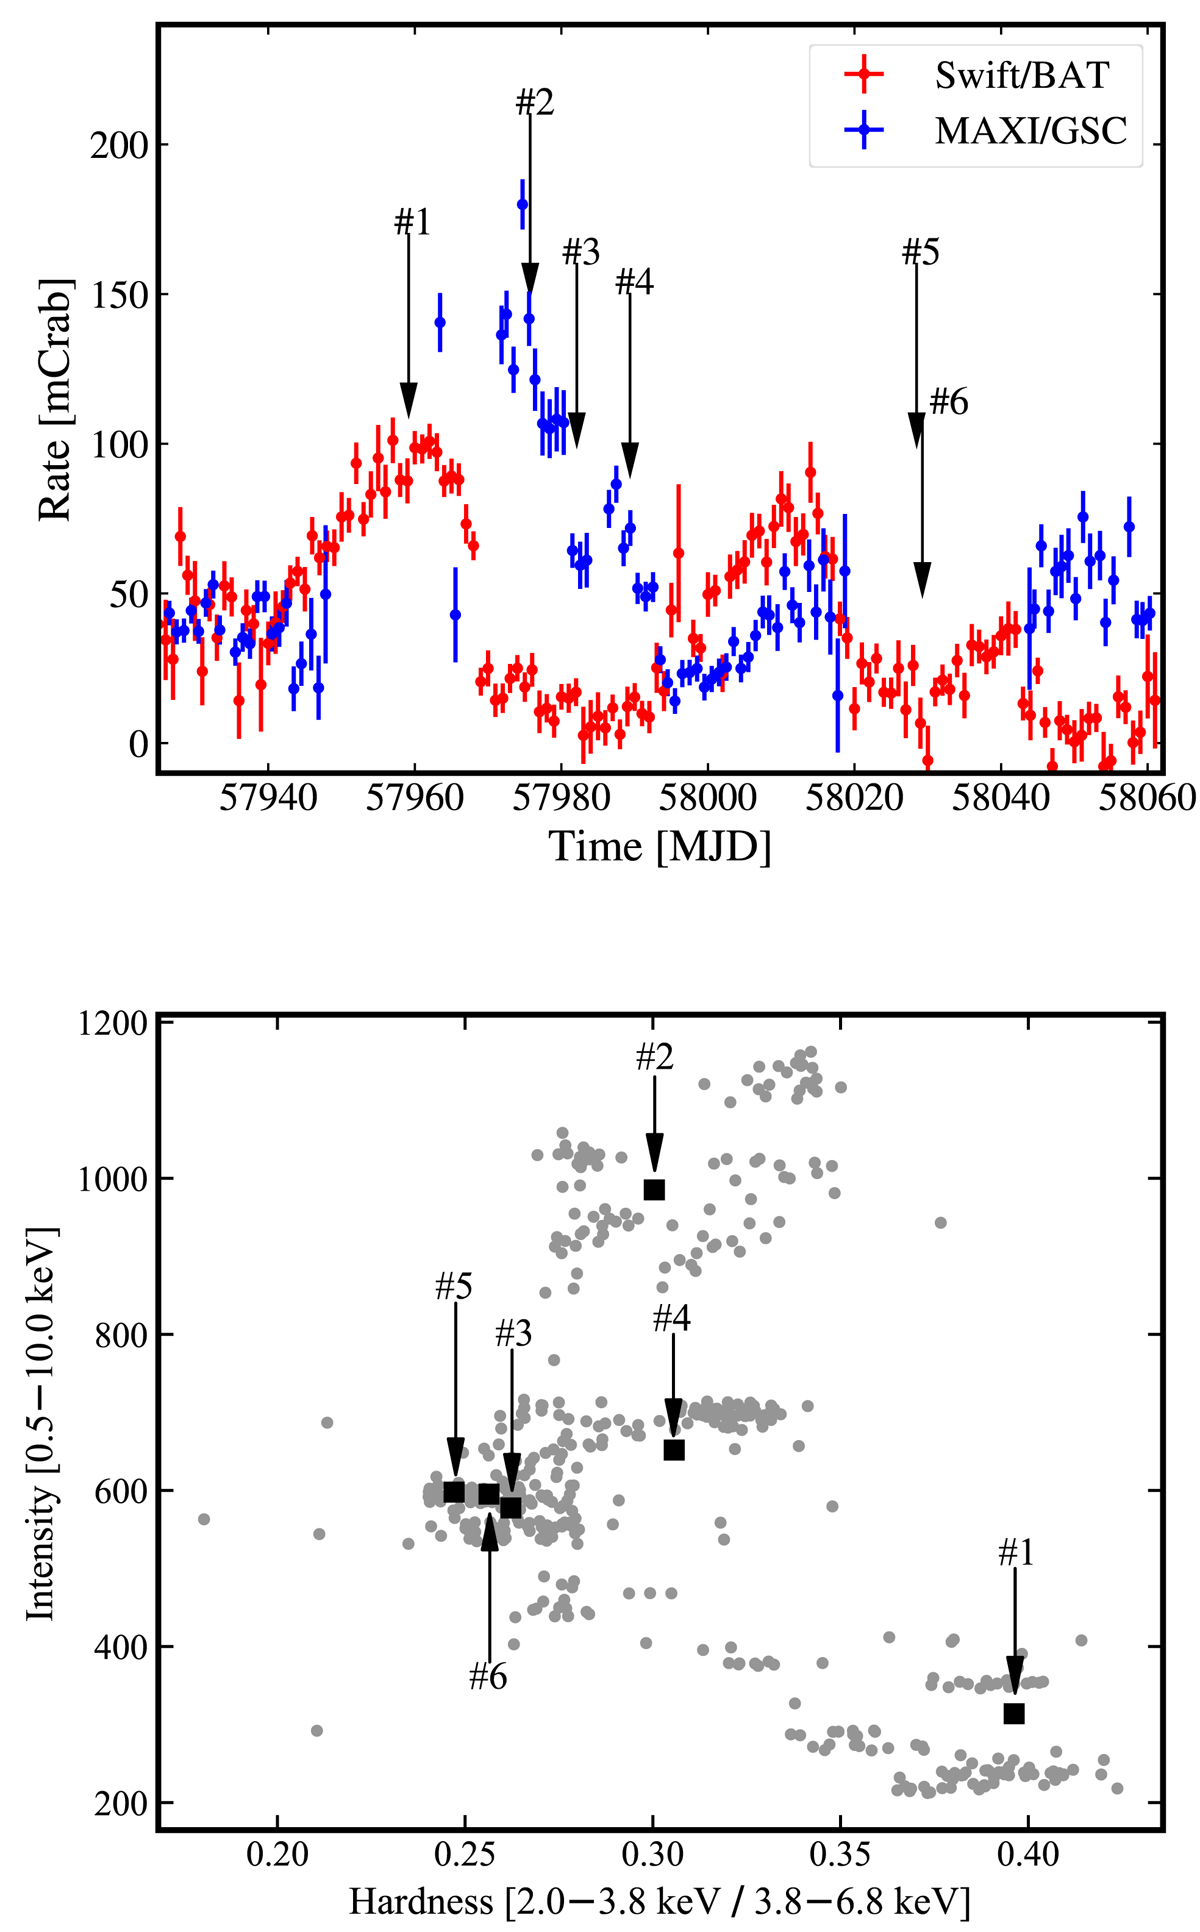
Rate and spectral states of all six X-ray bursts. Top panel: Swift/BAT (red, 15−50 keV) and MAXI/GSC (blue, 2−20 keV) light curves of 4U 1636–536 in units of Crab rate. The arrows represent six X-ray bursts observed by NICER. Bottom panel: HID from NICER observations. All bursts are removed, and each point represent a segment of 64 s. The HID of the persistent emission prior to each X-ray burst has been marked as black square. We focus on bursts #4 and #5.
Current usage metrics show cumulative count of Article Views (full-text article views including HTML views, PDF and ePub downloads, according to the available data) and Abstracts Views on Vision4Press platform.
Data correspond to usage on the plateform after 2015. The current usage metrics is available 48-96 hours after online publication and is updated daily on week days.
Initial download of the metrics may take a while.