Fig. 7.
Download original image
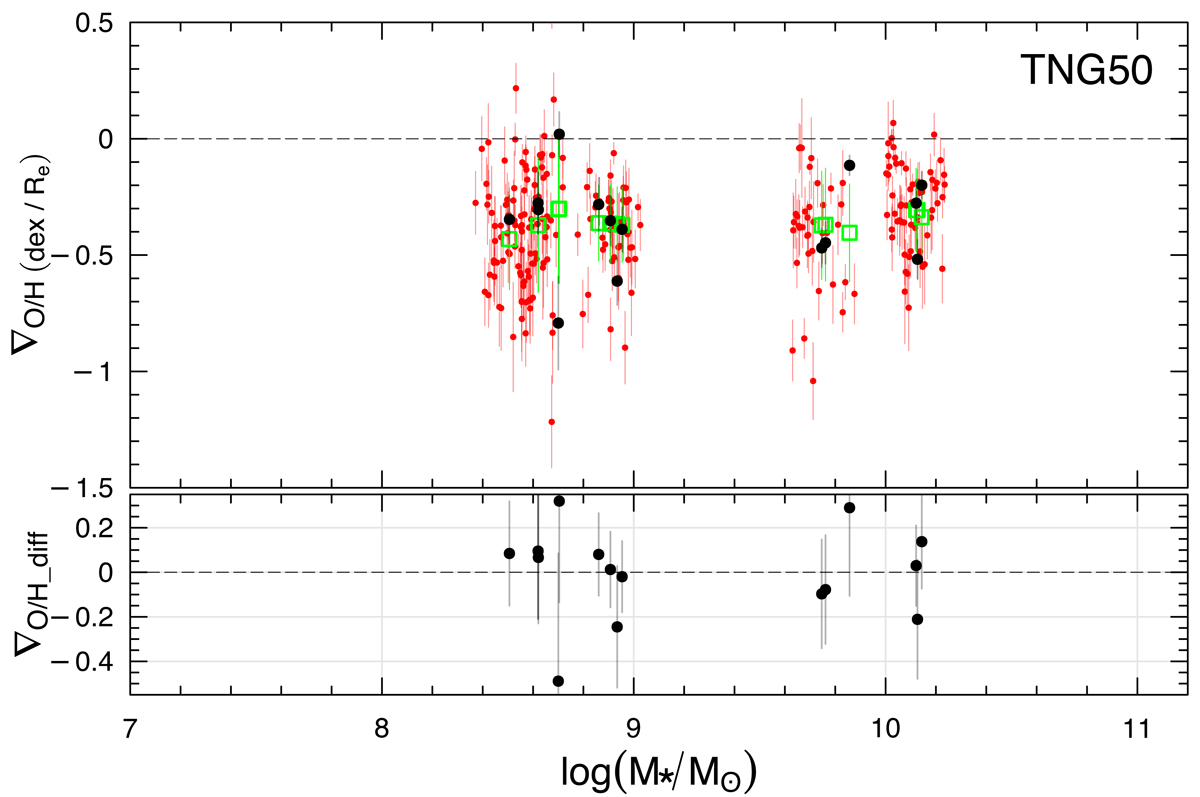
Gas metallicity gradients as a function of stellar mass for the subhalos from the TNG50 simulation. The black circles correspond to the subhalos in Fornax-like clusters, while the red circles indicate subhalos from our control sample (see text). The green squares show the median value ![]() for the control sample, and the vertical line shows the 1σ dispersion. Bottom panel: difference in metallicity gradient between each subhalo and the corresponding
for the control sample, and the vertical line shows the 1σ dispersion. Bottom panel: difference in metallicity gradient between each subhalo and the corresponding ![]() value for the control sample.
value for the control sample.
Current usage metrics show cumulative count of Article Views (full-text article views including HTML views, PDF and ePub downloads, according to the available data) and Abstracts Views on Vision4Press platform.
Data correspond to usage on the plateform after 2015. The current usage metrics is available 48-96 hours after online publication and is updated daily on week days.
Initial download of the metrics may take a while.