Fig. 10.
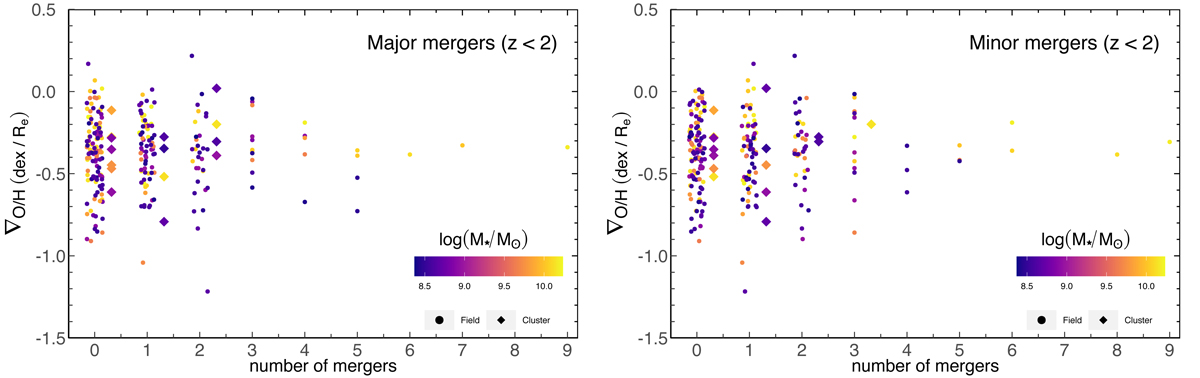
Download original image
Gas metallicity gradient as a function of the number of mergers up to redshift 2. Left and right panels: indicate major and minor mergers, respectively. Circles indicate subhalos from the control sample, while diamonds the subhalos in Fornax-like clusters. All the symbols are color coded according to their stellar mass. For the sake of clarity, all the subhalos in the control sample with a number of mergers between 0 and 2 were assigned random shifts (in the range ±0.25) around their actual value, while the subhalos in Fornax-like clusters are shifted to the right.
Current usage metrics show cumulative count of Article Views (full-text article views including HTML views, PDF and ePub downloads, according to the available data) and Abstracts Views on Vision4Press platform.
Data correspond to usage on the plateform after 2015. The current usage metrics is available 48-96 hours after online publication and is updated daily on week days.
Initial download of the metrics may take a while.