| Issue |
A&A
Volume 660, April 2022
|
|
|---|---|---|
| Article Number | A133 | |
| Number of page(s) | 31 | |
| Section | Extragalactic astronomy | |
| DOI | https://doi.org/10.1051/0004-6361/202142629 | |
| Published online | 26 April 2022 | |
A search for ionised gas outflows in an Hα imaging atlas of nearby LINERs⋆
Instituto de Astrofísica de Andalucía – CSIC, Glorieta de la Astronomía s/n, 18008 Granada, Spain
e-mail: This email address is being protected from spambots. You need JavaScript enabled to view it.
Received:
9
November
2021
Accepted:
13
January
2022
Abstract
Context. Outflows play a major role in the evolution of galaxies. However, we do not yet have a complete picture of their properties (extension, geometry, orientation, and clumpiness). For low-luminosity active galactic nuclei (AGNs), in particular low-ionisation nuclear emission line regions (LINERs), the rate of outflows and their properties are largely unknown.
Aims. The main goal of this work is to create the largest up-to-date atlas of ionised gas outflow candidates in a sample of 70 nearby LINERs. We aim to use narrowband imaging data to analyse the morphological properties of the ionised gas nuclear emission of these galaxies and to identify signatures of extended emission with distinctive outflow morphologies.
Methods. We obtained new imaging data from Alhambra Faint Object Spectrograph and Camera (ALFOSC)/Nordic Optical Telescope (NOT) for a total of 32 LINERs, and complemented it with Hubble Space Telescope archival data (HST) for six objects. We extracted the Hα emission of the galaxies and used it to morphologically classify the circumnuclear emission. We combined our results with those from the literature for additional 32 targets. We additionally obtained soft X-ray data from Chandra archive to compare this emission with the ionised gas.
Results. The distribution of the ionised gas in these LINER indicates that ∼32% show Bubble emission, ∼28% show Core-halo unresolved emission, and ∼21% of the sample have a Disky distribution. Dust lanes prevent any detailed classification for ∼11% of the sample, which we call Dusty. The soft X-ray emission is in most cases (∼60%) co-spatial with the ionised gas. If we account for the kinematical information which is available for a total of 60 galaxies, we end up with a total of 48% of the LINERs with detected outflows or inflows in the emission lines (50% considering only kinematical information based on Integral Field Spectroscopic data).
Conclusions. Our results suggest that the incidence of outflows in LINERs may vary from 41% to 56%, based on both the Hα morphology and the kinematical information from the literature. The ionised gas seems to be correlated with the soft X-ray emission, so that they may have a common origin. We discuss the use of Hα imaging for the pre-selection of candidates likely hosting ionised gas outflows.
Key words: galaxies: active / galaxies: nuclei / galaxies: structure / galaxies: kinematics and dynamics / galaxies: statistics
Based on observations made with the Nordic Optical Telescope, operated by the Nordic Optical Telescope Scientific Association at the Observatorio del Roque de los Muchachos, La Palma, Spain, of the Instituto de Astrofisica de Canarias.
© ESO 2022
1. Introduction
Outflows are believed to play an important role in the evolution of galaxies (e.g. Kormendy & Ho 2013; Cresci & Maiolino 2018; Veilleux et al. 2020). Those driven by active galactic nuclei (AGNs) interact with the gas in the host galaxy generating both negative and positive feedback processes that affect the evolution of the host with notable effects, such as gas-recycling or the suppression of star formation (e.g. Fabian 2012; Cresci & Maiolino 2018). Outflows are characterised by their multi-wavelength phases (cold, warm, and ionised gas), whose analysis is needed to fully understand their importance on the evolution of their host galaxies (e.g. Cazzoli et al. 2014; Cicone et al. 2014; Ramos Almeida & Ricci 2017; Morganti 2017; Veilleux et al. 2020; Fluetsch et al. 2021).
These galactic outflows are commonly seen in all AGN types (e.g. Veilleux et al. 2005, 2020; Morganti 2017), including a handful of low-ionisation nuclear emission-line regions (LINERs; Heckman 1980). Given that the presence of outflows has been suggested to be ubiquitous within the AGN population (e.g. Veilleux et al. 2005; Concas et al. 2019), it is also expected to be the case for low-luminosity AGNs like LINERs. Even so, this field is largely unexplored except for few works (Cazzoli et al. 2018; Hermosa Muñoz et al. 2020). This is probably a result of a bias towards the search of outflows in powerful AGNs, where these outflows are more easily identified because the outflow rate scales with the AGN luminosity (Fluetsch et al. 2019). Nevertheless, much less is known for the largest population of AGNs in the Local Universe, which is dominated by LINERs (Ho et al. 1997). Mainly hosted in early-type galaxies (Ho 2008), their AGN nature is not yet clear for all objects (Márquez et al. 2017), given the existence of other mechanisms such as shocks (Heckman 1980; Dopita & Sutherland 1995; Molina et al. 2018) that could explain the observed spectra of these systems.
One of the best ways to identify the presence of outflows is using kinematical information via 2D spectroscopy (e.g. Davies et al. 2014, 2020; Harrison et al. 2016; Mingozzi et al. 2019; Cazzoli et al. 2020, and in prep.; Raimundo 2021). These spectroscopic measurements allow us to obtain resolved information of the gaseous component of a galaxy at low (e.g. Raimundo 2021) and high redshift (e.g. Harrison et al. 2016). In more luminous AGNs the kinematical component of the emission lines associated with the outflow can dominate and be the more predominant feature of the spectra, above other rotational movements of the internal gas (Davies et al. 2020). However, in the absence of spectroscopic data, outflows may be detected or at least glimpsed by using imaging techniques, even when the activity of the host galaxy is low (Masegosa et al. 2011). In the works by Pogge et al. (2000) and Masegosa et al. (2011) they studied the extended ionised Hα emission of several LINER-like galaxies. In the latter work this emission was classified in different morphological types depending on the distribution of the ionised gas. One of the possible classifications is outflow-like, referred to as extended filamentary or bubble-like gas extending out of the galaxy nuclei. For some galaxies this ionised gas emission with morphological signatures of outflowing gas was later confirmed as an outflow by means of kinematic data obtained from 2D spectroscopy (see e.g. NGC 4676A in Wild et al. 2014).
In this paper our objectives are (i) to create an atlas of the ionised gas morphology of a sample of nearby LINERs (z < 0.025) that is almost twice as large as the previously existing sample; (ii) to search for morphological evidence of possible outflowing gas that could be associated with feedback processes in order to determine how common outflows/inflows may be for the LINER AGN family; (iii) to compare the Hα morphology to that seen in X-rays (when possible) in order to investigate possible correlations between the two emissions, as seen in different AGN types in previous works (Bianchi et al. 2006, 2019; Masegosa et al. 2011); and (iv) to look for kinematically identified outflows in the literature within our targets in order to test the goodness and eventual relation of the morphological signatures in the actual detection of outflows.
This paper is organised as follows. Section 2 describes the selection of the sample and the data gathering. In Sect. 3 we present the data reduction. In Sect. 4 we show the main results of the Hα and X-ray morphologies. We discuss the kinematical signatures of outflows identified in the literature for our targets, its relation with the gas morphology, and the implications of our work in Sect. 5. Finally, Sect. 6 summarises the main conclusions. Individual comments on each galaxy are in Appendix A; all the figures can be found in Appendix B.
2. Sample and data
The total number of objects analysed in this work is 70 LINERs (see Table C.1), which were selected as explained below. The parent sample of our dataset comes from González-Martín et al. (2009a), where the X-rays properties of 82 LINERs were analysed, and is complemented with 11 LINERs from Cazzoli et al. (2018) and 2 from Pogge et al. (2000). We included in the sample one additional LINER (NGC 5957) not present in either of the initial samples, but for which we have integral field spectroscopic data (Hermosa Muñoz et al., in prep.). To select the targets, we applied the following criteria: (i) all galaxies should have distances not larger than 100 Mpc in order to ensure that the galaxies fitted in the field of view (FoV) allowing parsec-scale structures to be detected and (ii) the systems could not be on a high level of interaction. The first criterion excluded 14 galaxies and the second excluded 5 objects. This lead to 77 objects, 32 of which were already studied in Masegosa et al. (2011, hereafter M11) and 4 in Pogge et al. (2000). Among the 32 targets in M11 we found NGC 4676A and B, which are on a high interacting level, so we excluded them. We added NGC 3379 and NGC 4278 to the remaining 41 targets as they were analysed in M11 based only on their Hβ emission, but not the Hα emission. Thus, we ended up with 43 LINERs, from which we were able to gather data for 38 targets (see Tables C.2 and C.3, Sect. 2.1).
To achieve the largest statistics of Hα images possible, our final sample encompasses the 38 new targets with those from M11 and Pogge et al. (2000) with previous observations (32 targets, excluding NGC 3379, NGC 4278, NGC 4676A and B). Hence, the complete sample we analysed is 70 LINERs. We estimated the bolometric luminosity of the sources with the X-ray luminosity (2−10 keV) following González-Martín et al. (2009b) (see Fig. 1). The typical bolometric luminosity of our sources is 1041.8 erg s−1 (see Table C.1).
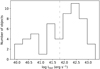 |
Fig. 1. Histogram of the bolometric luminosities (in log units) of the selected sample of LINERs. The luminosities were estimated from González-Martín et al. (2009b) (see Table C.1). The dashed grey line indicates the average value (1041.8 erg s−1). |
2.1. Data gathering
We searched for archival data in any available narrow filter from the HST for the 43 objects that corresponded to the Hα line at the redshift of the targets, finding 6 objects with at least one image available (see Table C.2). The selected filters are indicated for each object in Table C.2. Our aim was to observe the remaining 37 objects with the Alhambra Faint Object Spectrograph and Camera (ALFOSC) at the Nordic Optical Telescope (NOT) during several observing campaigns (see Table C.3).
The ALFOSC instrument is located at the NOT telescope (2.56 m), at the Roque de los Muchachos observatory, in La Palma, Spain. We used its camera in imaging mode, with a total FoV of 6.4′×6.4′ and a pixel scale of 0.214″ pix−1.
The data were gathered over a total of 14 nights (PIs: S. Cazzoli and L. Hermosa Muñoz; see Table C.3). We obtained six individual exposures for each galaxy, three in the narrowband filter and three in the broadband filter, with typical exposure times of 1200 s and 300 s, respectively. For some objects the broad filter images were observed with shorter exposure time to avoid saturation of the galaxy centre. The total time on source per galaxy was 1.25 h. The average seeing and airmass were 0.92″ and 1.24, respectively; the corresponding information for the different nights is listed in Table C.3.
We used the narrow filters from NOT, which allowed us to observe the ionised gas of the LINERs at their given redshifts, that corresponded to the Hα line. As indicated on the NOT web page1, these are #49 (661_5 – full width at half maximum, FWHM 50 Å), #50 (665_5 – FWHM 55 Å), #68 (664_4 – FWHM 40 Å), #77 (662_4 – FWHM 39 Å), #78 ([N II]658_4 – FWHM 36 Å), and #123 ([S II] 672_5 – FWHM 50 Å). As for the broad filter, we used the standard R-band filter from the Sloan Digital Sky Survey (as indicated on the NOT web page: r′_SDSS 625_140 – FWHM 1400 Å). The selected narrow filters are wide enough to also include one of the [N II]λλ6548,6584 Å emission lines. However, we chose the filters such that the only other emission line that could also fit within the filter is the [N II]λ6548 Å line, which is weaker than the [N II]λ6584 Å line (relation 1:3, see Osterbrock & Ferland 2006). Contamination of the Hα line due star formation processes could exist. However, we do not expect this to be important as all our sources are early-type galaxies (see morphological types in Table C.1), where the star formation is expected to be less important than in later host types.
The presence of several ghosts contaminated the images of NGC 0474 and NGC 0524, observed with NOT filter #77. This prevented a reliable analysis, and therefore these two galaxies were excluded from the sample. NGC 5957 was observed while high clouds appeared during at least one individual exposure, dimming the object flux. Finally, due to bad weather conditions and time constraints to finish the last observing run, three objects (NGC 0833, NGC 0835, and NGC 2655) were not observed. Thus, the campaign was completed up to a ∼90% of the sample (37 objects).
2.2. X-ray data
We searched for X-ray data in the Chandra Data Archive for all the new galaxies in the sample (38 objects) for which we obtained optical data, to compare their soft emission (0.3−2 KeV) with the ionised gas. We retrieved X-ray images taken with the Advanced CCD Imaging Spectrometer (ACIS) for a total of 28 objects. We estimated the 3σ contours of the emission and superimposed them to the Hα images.
For the data coming from M11, there is a similar analysis with both hard and soft X-ray Chandra images. They gathered data for a total of 26 objects, whose results we discuss in Sect. 5.2. The images from their objects can be found in their Fig. 6.
2.3. Kinematical information
By searching in the literature we retrieved kinematical information for all the LINERs either from Integral Field Spectroscopy (IFS) (30 galaxies) or long-slit spectroscopic data (30 galaxies). When a target was analysed with IFS data, we prioritised 3D results over those coming from long-slit spectroscopy. The previous works analysing the different targets (see Sect. 5.1 and Appendix A for more details on the individual sources) discuss the possible presence of outflows/inflows or non-rotational motions in the galaxies for 28 objects. We compare the morphologically identified outflows with those kinematically identified (or undetected) in Sect. 5.1.
3. Data reduction process
The data gathered from the HST archive were already fully reduced and the narrowband images of the galaxies were already combined in those cases where there was more than one available. However, given that the HST observations are from the archive, some of the selected narrow filter (NF) images were not observed the same night as the broad filter (BF) images (see Table C.2). We tried to select, when possible, the BF with the closest wavelength range to the NF range. Thus, the only procedure applied to HST data was the realignment of the NF and BF images when they were obtained in different observing campaigns (see Table C.2). Specifically, we used the position angles on the header of the different frames to set the images to a common north-east axis reference. Then the outermost elliptical isophotes were fitted to ellipses, providing us with the centres and position angles that were used to apply the corresponding shift and rotation for alignment. Finally, we trimmed the images to where both had information.
The data from ALFOSC/NOT were reduced following standard procedures (bias and flat-fielding) with both IRAF2 and PYTHON routines. We performed a dedicated background subtraction to the ALFOSC/NOT images required for a reliable sky determination. An example of the procedure is shown in Fig. 2. We used PHOTUTILS routines under a PYTHON environment to mask external stars, galaxies, and artefacts from the filter, and to estimate a 2D background. We created masks for objects detected at least at 3σ over the background in the BF images (as the flux is usually more extended in this filter) and applied them to the NF images. The background in the masked pixels could not be estimated, so we used the median value of the background in the rest of the image. Then we made a smoothing of the background image (100 × 100 pixels) so that no structures were included due to the masks, and we subtracted the final smoothed background image for each galaxy and filter.
 |
Fig. 2. Example of background subtraction process for NGC 6482. Left: original narrowband image of the galaxy. Middle left: mask applied to the original image over imposed to the estimated background. Middle right: final smoothed background. Right: final narrowband image with the corresponding background subtracted. The scale in the left and right panels is approximately the same as the background level to show the differences before and after the subtraction (see Sect. 3 for more details). |
In order to obtain exclusively the emission of the galaxies in the Hα line, we subtracted the continuum of the narrowband images using broadband images of the same targets. For ALFOSC/NOT, the BF images were observed on the same night as the NF images. The procedure follows that from M11. The NF images include the Hα emission and also the underlying continuum. The line emission is usually less extended than the continuum, which is translated into the fact that, at large scales in the galaxy, the NF and BF images should return comparable emissions. Thus, we scaled the BF image to the NF image and then subtracted them to obtain the Hα image.
The peculiar morphologies of the galactic continuum in the studied galaxies are highlighted by the use of sharp-divided images (e.g. Márquez & Moles 1996; Márquez et al. 1999, 2003). Briefly, this technique consists in dividing the BF image by its smoothed version, which is the original image convolved with a median filter of a 20-pixel box. Although simple, this method is very useful, especially for detecting asymmetries on the image, such as bars, rings, spiral arms, or dust regions. The sharp-divided images of the galaxies are shown in the right panels of Appendix B.
The Chandra X-ray images were reduced following the Chandra threads for the ACIS instrument, using the dedicated software CIAO v4.13 and the calibration package CALDB 4.9.5. After downloading the data, we applied the most recent calibrations running the script ‘chandra_repro’ and restricted to the energy range to 0.3−2 KeV. We extracted background light curves from the event files using the CIAO tool DMEXTRACT in order to eliminate high background events. Based on these background light curves, we generated good time intervals for our images excluding time intervals that deviated 1σ from the mean rate of counts in the background using the CIAO tool DEFLARE.
4. Results
We classified the circumnuclear Hα morphologies of the galaxies into four different categories: Core-halo, Disky, Bubble, and Dusty. An example of each morphological type is shown in Fig. 3. The properties of the ionised emission included in these categories are fully explained in M11. The basic definitions are as follows: (i) Core-halo is for unresolved nuclear emission in the galaxy centre; (ii) Disky is for ionised emission along spiral arms, star-forming rings, or diffuse emission in the disk; (iii) Bubble is equivalent to the ‘Outflow’ morphology in M11, and refers to biconical, filamentary, or bubble-like structures emerging from the nucleus; and (iv) Dusty is for mostly edge-on galaxies with dust lanes obscuring the nuclear emission. We classified all the targets using visual inspection of the Hα images, considering all the emission detected above 3σ from the background. Our classification is given in Table 1. We assigned a morphological class when three or more authors agreed on the classification. This happened for 87% of the targets from the new data. The remaining 13% (5 out of 38) had ambiguous morphologies that could be included in various classes. To enable a more direct discussion, we defined for them an additional category: Unclear. In this section we account only for the new observed data, as the results for the other targets are presented in M11 and Pogge et al. (2000). More details on the individual galaxies can be found in Appendix A; all Hα and sharp-divided images are in Appendix B, and the soft X-ray images (in contours) are discussed in Sect. 4.2.
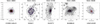 |
Fig. 3. Examples of the five proposed morphological classifications of the nuclear Hα emission (see Sect. 4). The complete images are in Appendix B. |
Morphological classification of the Hα nuclear emission, as in M11.
4.1. Ionised-gas morphological classification
We identified a total of 12 LINERs that show Core-halo emission. Among them, NGC 4261, NGC 4589, and NGC 6482 (see Figs. B.5, B.7, and B.9, respectively) show extended emission probably elongated along their galaxy disks; NGC 3884, NGC 4278, NGC 4772, and NGC 5957 (see Figs. B.3, B.5, B.8, and B.9, respectively) have an unresolved, not elongated nuclear emission; in the remaining galaxies, NGC 0410, NGC 4450, NGC 4494, NGC 4698, and NGC 7743 (see Figs. B.1, B.6, B.7 and B.10, respectively) the Hα emission is extended and detected at the 3σ level at distances greater than > 10″ from their nuclei.
The Disky morphology is found in nine galaxies. For NGC 0841, NGC 3642, NGC 4321 and NGC 4457 (see Figs. B.1, B.3, B.5, and B.6) the emission is found along a star-forming ring or arm, where several clumps are easily identified. In three galaxies, namely NGC 3185, NGC 3507, and NGC 5077 (see Figs. B.2 and B.8), the emission shows a twisted and elongated shape that may be ascribed to a bar or to large-scale spiral arms or discs. Finally, for two galaxies, NGC 3608 and NGC 3898 (see Figs. B.3 and B.4, respectively), the emission is extended along the disk with no clumps or evidence of star formation.
There are only three objects classified as Dusty as they show clear dust lanes that prevent us from analysing their nuclear emission (NGC 3628, NGC 4125, and NGC 5746). However, we note that this classification is based on the innermost regions (∼20″) of the galaxies. NGC 3628 (Fig. B.3) is known to have extended emission further out from the nuclei; large-scale Hα emission is clearly visible in the southern parts of the galaxy (Fabbiano et al. 1990). In our image this plume is barely detected at the 1σ level (see Fig. 4), and this analysis is thus beyond of the aim of this paper. NGC 4125 (Fig. B.4) has some extended emission, but clearly around dust lanes, thus we were conservative in its classification. For NGC 5746 (Fig. B.8) the emission is barely visible through some regions of the galactic disk, thus not reliable for a proper morphological classification.
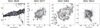 |
Fig. 4. Large-scale Hα images of NGC 3628, NGC 5077, NGC 5363, and NGC 5813. The largest contours indicate the 1σ level over the background signal, except for NGC 5363, where it represents 3σ. The corresponding images on a smaller scale (∼10″ × 10″) with the 3σ detection are shown in Appendix B. |
We identified nine LINERs that may have an outflowing emission with complex ionised gas morphologies. NGC 0266, NGC 3414, NGC 4596, and NGC 4750 (see Figs. B.1, B.2, and B.7) show a faint extended emission parting asymmetrically from the photometric centre of the galaxies. The NGC 3945 image reveals a filamentary structure (Fig. B.4). For NGC 2685, NGC 3379, and NGC 5813 (see Figs. B.1, B.2, and B.9) the Hα emission has a biconical or bubble-like shape oriented almost perpendicular to the major axis of the galaxies (inclination of NGC 2685 is 60°, not measured for the other two; see Table C.1). NGC 4459 (see Fig. B.6) can also be included in this group as the nuclear emission in the inner 3″ × 3″ resembles the base of an outflowing bubble. All the objects would benefit from detailed spectroscopic information with spatial resolution to determine the extent and origin of their emission.
Finally, there are five galaxies (NGC 4143, NGC 4203, NGC 5363, NGC 5838, and NGC 7331) with Unclear morphologies. NGC 4143, NGC 4203, and NGC 5838 are classified twice in this work as Bubble and Disky (see Figs. B.4, B.5, and B.9). In these cases the emission seems to be extended along the galaxy disk, but with a non-symmetrical distribution. These asymmetries may be produced by outflows instead of being associated with the disk, which leads to the unclear classification. For the case of NGC 5363 (Fig. B.8) a nuclear dust lane of ∼1 kpc is obscuring the nucleus, although at larger scales (≥20″) there is an extended filamentary emission of ionised gas (see Fig. 4). The morphological differences at both scales lead to a double classification as Dusty and Bubble. NGC 7331 (Fig. B.10) is classified as both Dusty and Bubble, as we detect some extended emission out of the nucleus, but we cannot be sure that this Hα profile is symmetrical as a thick dust lane is visible within the galaxy disk.
There are two galaxies, NGC 3379 and NGC 4278 (Figs. B.2 and B.5), that were observed in our sample even though they were also analysed in M11. The only available data in the HST archival were in the narrow filter corresponding to the [O III] line emission (filter F547M). In our work we obtained data for these galaxies in the Hα wavelength range in order to have a uniform comparison of all the nuclear emissions in the galaxies from the sample. For M11, NGC 3379 (NGC 4278) was classified as having a Disky (Core-halo) emission. We agree on the classification of NGC 4278, but on the contrary we classified NGC 3379 as Bubble as the inner Hα morphology shows an elongated shape that cannot be ascribed to either of the other possible classifications. This elongated emission is coincident with a dust lane crossing the nuclear region, visible in Hβ (Masegosa et al. 2011). It could also be an effect produced by a bar (see individual comments in Appendix A) as the sharp-divided image (see Fig. B.2) is X-shaped, which is usually ascribed to barred systems (Laurikainen & Salo 2017).
4.2. Soft X-ray images properties
Some previous works have studied the correlation between the soft X-ray and ionised gas emissions for different AGN types (Bianchi et al. 2006; M11), such that both emissions are believed to originate from the photoionisation of the gas around the AGN (Bianchi et al. 2006, 2019). These results are discussed in Sect. 5.2. For the new data, we searched for X-ray data with resolution comparable to that of the ALFOSC/NOT 38 Hα images. The soft X-ray contours are shown in Fig. 5. The emission for 11 galaxies is mainly point-like around the nucleus, which would be equivalent to a Core-halo classification (see Sect. 4). We find 12 objects with an extended emission and 5 with clumpy emission. Despite the different morphologies, the soft X-ray emission is co-spatial with the ionised gas for 12 galaxies (see Table 3).
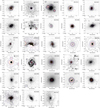 |
Fig. 5. Hα images with overlaid contours of the X-ray emission from Chandra. The contour levels are at 3σ (black), 7σ (black), 15σ (black), 25σ (dark purple), 40σ (purple), 60σ (light purple), 80σ (red), 100σ (orange), and 150σ (yellow). |
If we separate those galaxies in which both emissions are coincident, at least in the direction of the emission, we end up with 12 LINERs (NGC 0266, NGC 0410, NGC 3414, NGC 3884, NGC 3945, NGC 4261, NGC 4450, NGC 4596, NGC 4750, NGC 4772, NGC 5813, NGC 5838). One example is NGC 5813, for which the Hα image, especially at large scales, shows an extended filamentary structure (see Fig. 4) with a bubble extending up to 10″ in the north-west direction with respect to the centre. The X-ray emission is rather complex, with the same bubble almost co-spatial with the Hα emission (see Fig. 5).
The most notable difference in the remaining objects lies in the extension of the emission, being in some cases much more extended in the X-rays (e.g. NGC 4278; see Fig. B.5), and in other cases in Hα (e.g. NGC 4698; see Fig. B.7).
4.3. Global picture of ionised gas morphologies in LINERs
For the new imaging data obtained with NOT and HST, as drawn by the detected Hα emission at 3σ level, the nuclear ionised gas in these LINERs is extended (≥5″) in the majority of the cases (32 objects; ∼84%). This emission is not exclusively along spiral arms or nuclear disks, but is also due to possible outflows (e.g. filamentary structures) or perhaps other events at large scales (i.e. > 1′; see Fig. 4) such as mergers (e.g. NGC 4125; see Appendix A and Fig. B.4).
Within our new data, as already mentioned in Sect. 4.1, we have nine objects of Bubble morphologies in the Hα nuclear emission, which corresponds to ∼25% of the sample. The same percentage also applies for Disky emission (9 LINERs), whereas the majority are classified as Core-halo (12 LINERS; ∼32%). However, if we consider all the measurements and classifications in previous similar studies, larger statistics can be made. More specifically, in M11 they provided the final morphological classification for 30 LINERs, accounting for the data in Pogge et al. (2000) (see Sect. 2).
In this work we added a total of 38 new LINERs, considering both NOT and HST datasets. Summing up, we have Hα morphological information for a total of 70 LINERs, such that 32% of them are classified as having outflow-like emission, 29% show Core-halo morphology, 21% are classified as Disky, 11% as Dusty, and 7% with Unclear morphology. These results indicate that one out of every three LINERs in the local Universe may have an outflow.
5. Discussion
The combined results of the 38 new objects from this work and the 32 from previous works (Pogge et al. 2000; Masegosa et al. 2011) constitute the largest sample to date of ionised gas morphological analysis of LINERs. The morphological features of the 70 galaxies indicate that a high percentage (32%) of LINERs have outflow-like ionised gas emission. However, we note that a dedicated spectroscopic follow-up using IFS is needed to firmly confirm what the morphological signatures suggest and to capture the full extension of the putative outflow. This especially applies to the targets with long-slit spectroscopic observations, where the outflow will not be detected if the slit is not properly oriented.
Although we classify all the images using the same criteria (see Sect. 4), we note that the HST and ALFOSC/NOT data have different spatial resolutions. This implies a loss of detail on the possible substructures present in the images, but it should not produce any relevant change in the classification of the ionised gas morphology as the categories defined rely on features large enough (e.g. discs or dust lanes) to not depend on parsec-scale structures (see Fig. 6). Specifically, the mean extension of the Hα emission within the HST data is 0.8 ± 0.3 kpc, whereas for the ALFOSC/NOT data it is 1.9 ± 1.3 kpc.
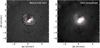 |
Fig. 6. Example of the ionised gas emission morphology of NGC 4750 seen with HST and ALFOSC/NOT spatial resolutions. Left: Hα emission observed with HST (M11). Right: smoothed version of the HST image with a Gaussian filter (σ ∼ 5) to match the ALFOSC/NOT resolution. In both panels the minimum contour is 3σ over the background and the maximum is 25σ (in yellow). |
We compare the ionised gas morphology with the morphological type of the host galaxy (see Table C.1) in order to see if there is any relationship with the Hα emission beyond the possible star-forming regions in the centres of those galaxies. We see no correlations of the morphologies in the data from M11, in the new data, or when considering both together (see Fig. 7). We note that the Hα nuclear emission of all the lenticular galaxies mixing both works was classified as outflow-like, although the sample is small (five objects) to firmly make any conclusion about it. All the targets are early types, ranging from E to Sb. This is expected as within the Palomar sample the largest fraction of AGNs (including higher accretion rates) were found among these morphological types (Ho 2008). We find that the majority of galaxies are spirals both in M11 and in this work (∼60%; see Fig. 7). This is in contrast to Ho (2008), who stated that for LINERs approximately 35% of the hosts galaxies were ellipticals, ∼45% were spirals, and 20% were lenticulars. We selected our LINERs based on their distances (see Table C.1) and a previous detection in X-rays that ensured their true nature as AGNs (see Sect. 2, González-Martín et al. 2009a). The different selection criteria of the samples may be causing the differing percentages.
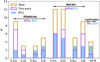 |
Fig. 7. Histogram of the morphological type of the host galaxy and the classification of the nuclear Hα emission. It is divided into ellipticals (E), spirals (S), and lenticulars (S0); CH stands for Core-halo, Di for Disky, Du for Dusty, and B for Bubble. The purple lines are for the sample from this work, blue for M11, and yellow for the combination of both samples. Unclear cases or irregular galaxies are not included in the figure, and thus the percentages do not sum up 100%. |
5.1. Outflow candidates with kinematic information
If we take into account all the cases from the sample in this work (see Sect. 4.1), M11, and Pogge et al. (2000), 60 LINERs have spectroscopic data (at least, from long-slit spectroscopy) available in some spectral bands. This information from the literature allows us to estimate the total percentage of kinematically confirmed (or suggested) outflows in the total sample.
For all the targets classified as Core-halo, Disky, and Dusty (43 targets) in our Hα data, there is kinematic information available for 33 objects, from which there are reported outflows/inflows in 15, as specified below.
From the 20 classified as Core-halo, 16 LINERs have kinematical information, and there are outflows reported for 8 LINERs: IC 1459, NGC 0315, NGC 2787, NGC 3884, NGC 3998, NGC 4278, NGC 4450, and NGC 7743. For NGC 0315, NGC 2787 (see also Ruschel-Dutra et al. 2021), NGC 3884, NGC 4278, and NGC 4450 the possible outflows (inflow for NGC 4278) were suggested by Cazzoli et al. (2018) with long-slit spectroscopy of the nuclear region. In IC 1459 the outflow was detected using IFU data from GMOS (Ricci et al. 2014, 2015), although the gas is associated with accretion from the surrounding galaxies with MUSE data in Mulcahey et al. (2021). For NGC 3998 there were hints of non rotational motions in Cazzoli et al. (2018), that were compatible with the perturbed kinematics of the [O III] emission using IFU data of the ATLAS3D survey (Boardman et al. 2017). For NGC 7743 there was an outflow detected in molecular gas using SINFONI (Davies et al. 2014), and several kinematical components detected in the ionised gas studied by Katkov et al. (2011).
In the case of the 15 LINERs classified as Disky, there is kinematical data for 13 targets. There are outflows/inflows reported only for four objects: NGC 2841, NGC 3642, NGC 4594, and NGC 5077. For NGC 2841, Schmidt et al. (2016) detected a small inflow of HI gas, although it is not clear if is caused by gas accretion or minor mergers. For NGC 3642 and NGC 4594 the outflows were detected with long-slit spectroscopy by Cazzoli et al. (2018) and Hermosa Muñoz et al. (2020), respectively. For NGC 5077 there is MUSE IFS data studied in detail by Raimundo (2021), who reports an outflow with the morphology of a hollow cone. The extended ionised emission corresponding to the outflow in that work is similar to what we find at larger scales (see Fig. 4).
From the eight targets classified as Dusty, six of them have kinematical information in the literature. Outflows have been reported for four LINERs: NGC 3226 (Cazzoli et al. 2018), NGC 3627 (inflow in Casasola et al. 2011), NGC 3628, and NGC 5866 (Li 2015). The case of NGC 3628 was already mentioned in Sect. 4.1. There are two hints of outflows in this galaxy (see individual comments in Appendix A), a kiloparsec-scale Hα plume (see Fig. 4) detected in various wavelength bands (Fabbiano et al. 1990; Tsai et al. 2012; Cicone et al. 2014; Fluetsch et al. 2019), and a sub-kiloparsec outflow reported in CO emission (Tsai et al. 2012; Cicone et al. 2014; Roy et al. 2016) that is not visible in our Hα data, due to obscuration from the dust lane (it is in the north direction at ≤20″ from the centre).
From the 22 LINERs classified as Bubble (see Sect. 4.1 and Table 1), there is kinematical information available for 21 targets, of which 10 have kinematically detected outflows with either IFS or long-slit spectroscopy. For 13 LINERs, namely NGC 0266, NGC 0404, NGC 1052, NGC 2685, NGC 3379, NGC 3414, NGC 4459, NGC 4486, NGC 4579, NGC 4596, NGC 4696, NGC 5813, and NGC 5846, there is IFS data available (see individual comments on each galaxy in Appendix A, and in Pogge et al. 2000 and M11). The IFS data provided hints for non-rotational motions in the velocity maps which could be associated with outflows only for six objects, namely NGC 0404, NGC 1052, NGC 3379, NGC 4486, NGC 4579, and NGC 4696. NGC 0404 images show extended Hα emission ascribed to gas blown out, possibly by starburst processes (Pogge et al. 2000), that is shown in Nyland et al. (2017) along with the central soft X-ray emission, which have similar extensions, suggesting the presence of shocks. This galaxy was suggested to have outflows associated with a small jet driven by the AGN using ALMA C0(2−1) data (Nyland et al. 2017), although the same emission was also ascribed to supernovae processes (Pogge et al. 2000; Boehle et al. 2018). NGC 1052 was studied in depth with IFS data, with all the works confirming an outflow in ionised gas (Dopita et al. 2015; Dahmer-Hahn et al. 2019; Cazzoli et al., in prep.). For NGC 3379 the outflow is detected with SAURON data in Shapiro et al. (2006). For NGC 4486 they are mentioned in Hermosa Muñoz et al. (2020), although the emission is defined as ionised gas filaments with unclear nature in López-Cobá et al. (2020) and Sánchez et al. (2021). For NGC 4579, the emission is ascribed to an outflow in several works with long-slit spectroscopy (Walsh et al. 2008; Davies et al. 2014; Mazzalay et al. 2014; Balmaverde & Capetti 2014; Molina et al. 2018), although within the NUGA project, there was an inflow detected in molecular gas, acting on different galactic scales (García-Burillo et al. 2009; Casasola et al. 2011). For the remaining seven objects, although there is disturbed gas, it is usually ascribed to past mergers or dust lanes that produce asymmetries in the gas velocities. For NGC 4696, Canning et al. (2011) analysed VIMOS/VLT IFU data, finding a filamentary structure with at least two different kinematic components, probably caused by interactions with the powerful radio jet and with other members of its galaxy cluster. NGC 2685 has a complex structure: a polar ring blended with an outer ring (see Appendix A). It was studied with long-slit spectra in previous works (Eskridge & Pogge 1997; Józsa et al. 2009; Hermosa Muñoz et al. 2020), but the different slits were not oriented in the direction of the possible outflow. Boardman et al. (2017) studied its [O III] emission with the ATLAS3D survey, finding perturbed kinematics likely not produced by mergers, but by gas accretion of unclear origin.
For the other eight galaxies with Bubble-like morphology there is only long-slit spectroscopic data available in the literature. There are outflows reported for four targets: NGC 3245 (in Walsh et al. 2008, although not confirmed in Hermosa Muñoz et al. 2020), NGC 4036 (in Walsh et al. 2008, although not confirmed in Cazzoli et al. 2018), NGC 4750 (as an asymmetry in the emission due to dust lanes and spiral arms emerging from the centre Carollo et al. 2002; Cazzoli et al. 2018) and NGC 5005 (from both space- and ground-based data in Cazzoli et al. 2018) using long-slit spectroscopy. For the other four objects there are no outflows detected (NGC 3718, NGC 3945, NGC 4438, and NGC 4636). However, NGC 4438 has an interesting morphological structure (see Fig. 2 in M11). A clear bubble emerging from the nucleus is seen in Hα (M11), although the slit was in a direction of the possible outflow in the study by Cazzoli et al. (2018). The nature of this structure would be analysed with IFS data (Hermosa Muñoz et al., in prep.).
There are five galaxies whose morphologies were classified as Unclear. There is kinematical information in the literature for four of them (NGC 4143, NGC 4203, NGC 5838, and NGC 7331), where three have reported outflows. For NGC 4143 there is only long-slit spectra available, from which the existence of outflows was suggested (Cazzoli et al. 2018). For NGC 4203, NGC 5838, and NGC 7331 there is resolved kinematical information available in the literature (see Appendix A). NGC 4203 is included in the ATLAS3D survey, and the H I shows non-rotational motions and inner dust lanes. H I data from the THINGS survey for NGC 7331 (Schmidt et al. 2016) indicates the presence of inflowing/outflowing emission, also suggested in previous works (Mediavilla et al. 1997; Battaner et al. 2003). Finally, for NGC 5838 there are no reported outflows. The IFS data comes from the SAURON survey (Falcón-Barroso et al. 2003; Sarzi et al. 2006), and although they detect asymmetries in the velocity maps, they ascribe them to dust in the nucleus.
Summarising, the kinematic information available for 60 LINERs indicates that there are a total of 29 objects (48%) for which the presence of outflows/inflows was either found or suggested by means of spectroscopic data. Their Hα morphology is classified here as Core-halo, Disky, Dusty, or Bubble; three of them are classified as Unclear (see Table 1 and Sect. 4.1). The derived percentage is higher than the percentage derived from the imaging data (32%, see Sect. 4.3). In Table 2 we show the estimated percentage of kinematically identified outflows for the morphological classes derived in this work. The percentages in Table 2 indicate that, on average, one out of every two LINERs in the nearby Universe may host an outflow. However, we note that we lack kinematical information for ten LINERs in the whole sample of 70, thus the rate may actually vary from 41% to 56% of LINERs with outflows.
Table 2 shows that among the classes with the largest number of objects (> 10), the two categories with the largest percentages are Core-halo and Bubble (50% and 48%, respectively). The objects classified as Disky show the lowest percentage within our classification (31%); this could be due to the outflow orientation and the inclination of the disk, which may challenge a possible outflow detection (see Sect. 5.3), especially at these low accretion rates where they are expected to be faint. The fraction of LINERs with kinematically confirmed outflows that are morphologically classified as Bubble emission is 34% (10 out of 29). This implies that for the majority of the detected outflows the ionised gas morphology does not show evident features of a Bubble-like emission.
If only IFS data are considered for the identification of kinematical outflows (30 objects with IFS data; see Table 3), only 15 have detected outflows (50%). Small numbers preclude a separate analysis by morphological class, since all but Bubble morphologies have IFS data for fewer than ten objects. There are 13 objects with IFS information between the Bubble morphologies, of which six (46%) show kinematical evidence of outflows, a slightly higher rate than that of the morphological detection (32%).
5.2. Soft X-ray–Ionised-gas relationship
It is noticeable that the Hα morphologies and the soft X-ray emission are coincident in a large fraction of the new data (∼30%), as is also the case for the targets analysed in M11. This behaviour has been seen previously for type 2 Seyferts (Bianchi et al. 2006), where the [O III] and the soft X-ray emission correlated. The work by Bianchi et al. (2019) suggested that Seyferts and LINERs have similarities in their narrow line regions (see also Pogge et al. 2000), which could lead to the conclusion that these two emissions are produced within the same region of the AGN, and thus a correlation should also be expected in LINERs. The correspondence of the ionised gas morphological signatures, the kinematic results, and the X-ray emission for all the galaxies for which we could retrieve data (56 targets, 28 of which from the new data; see Sect. 3) is in Table 3.
M11 performed a similar analysis on the objects from their sample. They gathered data for a total of 28 LINERs in both soft and hard X-rays using Chandra, four of which were NGC 3379, NGC 4278, and NGC 4676A and B (thus we consider 24 objects here). The results were that, generally, the soft X-ray emission traced that of the ionised gas, and they were correlated in all but four galaxies, which seemed to deviate from that trend (NGC 3226, NGC 4486, NGC 5846, and NGC 5866). From all the galaxies with X-ray data in their sample, 20 out of 24 (∼83%) showed a correlation in the emission.
By taking into account the new data in this work (see Sect. 4.2), of the 52 objects with soft X-ray data available in the Chandra archive, 31 of them (60%; see Table 3) show a correlation with the ionised gas emission. According to our results (see Table 3), 29 targets have reported outflows or inflows with kinematical information. Only 12 LINERs (namely IC 1459, NGC 2787, NGC 2841, NGC 3245, NGC 3884, NGC 3998, NGC 4036, NGC 4450, NGC 4579, NGC 4594, NGC 4696, and NGC 4750) have both features simultaneously, that is 23% (12 out of 52). However, the reported outflows in all the objects but five (IC 1459, NGC 2841, NGC 3998, NGC 4579, and NGC 4696) come from long-slit spectroscopy. As discussed previously (see Sect. 5), although useful, these spectra do not fully characterise the AGN and its environment, given the spatial limitations of the technique. This, combined with the small number of coincidences, does not allow us to draw any firm conclusions about a possible correlation between the presence of an outflow and an extended X-ray emission.
5.3. Comparison with other active galaxies
To date, there have been two systematic searches of outflows in LINERs with both ground- and space-based long-slit spectroscopic data. These were done by Cazzoli et al. (2018) and Hermosa Muñoz et al. (2020), who analysed 22 (type 1) and 9 (type 2) LINERs, finding an outflow detection-rate of 41% and 22%, respectively. Considering the sample number, the rate of outflows we report in this study (48%) is in agreement with that by Cazzoli et al. (2018).
There are several works searching for outflows in the nearby Universe for different active galaxies in different wavelength ranges (Cazzoli et al. 2016; Fiore et al. 2017; Fluetsch et al. 2019, 2021; Ruschel-Dutra et al. 2021), and also at higher redshifts (e.g. Harrison et al. 2016, 0.6 ≤ z ≲ 1.7, with ∼50% kinematic detections of ionised outflows). Within the kinematical data from the literature gathered in this work with LINERs in the Local Universe, not all the targets with kinematically identified outflows are based on ionised gas (19 out of 29 in ionised gas). There is evidence for extended outflows on different spatial scales (from sub-kiloparsec to several kiloparsec) associated with both AGNs and starburst activity (Veilleux et al. 2005, e.g. M 82, see Leroy et al. 2015). Luo et al. (2021) studied the ionised emission for 40 nearby (z < 0.1) type 2 AGNs, finding a correlation between the outflow sizes and the [O III] luminosities. The typical sizes of the kinematically identified outflows varied from 0.9 to 4 kpc (median 2 kpc), which are similar sizes to those quoted in previous works (e.g. mean of 1.8 kpc for luminous z < 1 AGNs in Bae et al. 2017; 0.1 to 3 kpc for six Seyfert-2 galaxies in Revalski et al. 2021). In this work we focus on the circumnuclear emission of the galaxies as it is expected that the possible outflows are less intense in LINERs. However, the Hα emission in our images has similar extensions, with a mean observed size of 1.9 kpc, ranging in all morphologies from 0.2 to 6 kpc (0.5 to ∼2 kpc for the Bubble-like morphologies alone).
Concas et al. (2019), by exploiting SDSS spectra, suggested that although the inclination of the host galaxy is crucial to detecting the outflowing emission, if the ionised outflows are AGN-driven and the accretion disk is not connected to the host disk, then the outflow may be launched in another direction not perpendicular to the host. Fischer et al. (2013) obtained the inclination of the AGN in 17 Seyfert galaxies, finding that the biconical outflows were more easily detected in those that were type 2 AGNs (i.e. oriented edge-on). From our imaging data and the kinematic analysis from the literature, we find that inclination could be important, as the lowest percentages of outflows are in Disky systems (e.g. NGC 4321). Given that the intensity of the outflowing gas scales with the activity of the AGNs (Fluetsch et al. 2019; Revalski et al. 2021), and that their extension is typically ∼1 kpc (one of the largest seen with our images is NGC 3945 ∼1.5 kpc; see Fig. B.4), we could be missing outflows due to inclination effects. As already found by Fischer et al. (2013), these effects are potentially more relevant for close to face-on targets in which the outflow has a cone-like shape, as the inclination effects may lead to inaccurate morphological classifications. Within our sample, between the kinematically detected outflows there are 19 type 1 (5 IFS, 14 LSS) and 10 type 2 LINERs (8 IFS, 2 LSS)3. Those detected with long-slit spectroscopy are only nuclear outflows. Curiously, for the IFS outflowing detections in type 1 LINERs the typical size is larger than 1 kpc (i.e. ∼1 kpc for NGC 1052, ∼2.3 kpc for NGC 4696, ∼5 kpc for IC 1450), whereas in type 2 LINERs the usual size is on sub-kiloparsec scales (i.e. ∼40 pc NGC 0404 or ∼700 pc for NGC 7743). This is expected based on the unified model as type 2 LINERs are oriented edge-on, and thus outflows oriented in the polar direction would be more easily detected than on more face-on type 1 LINERs.
6. Summary and conclusions
In this work we present a morphological analysis of 70 nearby LINERs with both ALFOSC/NOT and HST narrowband imaging corresponding to the Hα emission. We obtained new data for a total of 38 galaxies, whereas the remaining 32 come from previous works (Pogge et al. 2000, M11). The Hα imaging data indicate that among these AGNs there is a variety of morphologies within the ionised gas that can be classified in four different groups, as in M11, plus an additional class for objects with an ambiguous classification.
The statistics derived from the total sample of 70 LINERs suggest that ∼32% of LINERs have Bubble-like ionised gas morphologies, ∼29% show compact circumnuclear emission (Core-halo), and ∼21% have emission associated with the disk or the spiral arms of the host galaxy. For ∼11% of the sample we cannot state anything regarding the morphologies as there is nuclear dust preventing us from obtaining a complete vision of the ionised gas. Additionally, the complex distribution of the gas in ∼7% of the sample lead us to an unclear classification of the sources based exclusively on imaging information. However, there is kinematical information in the literature for 80% (four out of five) of these sources with Unclear morphology that provides more evidence on the possible origin of the emission (see Sect. 5.1).
Considering all the kinematic information available, accounting for both long-slit and IFS data, we have data for 60 LINERs. The statistics indicate that 48% of the objects show outflow kinematic signatures (see Sect. 5.1). This percentage is somewhat higher than that derived from the morphological signatures (32%). Since we still do not have kinematic information for ten targets of the 70 LINERs, the total rate could vary from 41% to 56% of LINERs with outflows. With the complete morphological and kinematical information combined, we find that at least one out of every three nearby (z < 0.025) LINERs may have a galactic outflow, probably associated with the activity of the supermassive black hole, given that they are mainly detected in ionised gas.
The morphological signatures combined with the kinematical information suggest that, considering our number statistics, it is equally probable to find an outflow in a LINER in which the ionised gas morphology is Bubble-like than Core-halo-like (see Sect. 5.1).
We found evidence that the soft X-ray emission follows that from the ionised gas in 31 LINERs (∼60% above the total with X-ray data) from the galaxies analysed in this work. This means that for the majority of targets there is a correlation between the ionised Hα gas and the soft X-ray, as is proposed in previous works for higher-luminosity AGNs (Bianchi et al. 2006, 2019). Both emissions are then expected to be raised in the same spatial region of the AGN. We note though that the results may vary, and that we could find (or not) a strong correlation between the emissions as we still lack soft X-ray data for 25% of the sample (i.e. 18 LINERs). Specifically, the correlation percentage may vary by up to 70% (44%) if both emissions are (are not) co-spatial for all the remaining targets. We do not see any correlation between the spectroscopically confirmed outflows and the co-spatiality of these emissions (ionised gas and soft X-rays). Therefore, with the data that we have, we can say that the soft X-ray emission is not a strong predictor of the presence of kinematically evident outflows. For the Hα imaging, considering all the kinematical information available, our results suggest that those objects with Disky structures have less probability of hosting an outflow, probably due to the orientation, whereas for the remaining morphologies, the probability of detection is 55%.
IRAF is the Image Reduction and Analysis Facility distributed by the National Optical Astronomy Observatories (NOAO) for the reduction and analysis of astronomical data.
The distribution of type 1 and type 2 LINERs in the complete sample is 38% and 62%, respectively (based on Ho et al. 1997; Cazzoli et al. 2018; Hermosa Muñoz et al. 2020).
Acknowledgments
We thank the anonymous referee for his/her very constructive comments that have helped to improve the paper. We acknowledge financial support from the Spanish Ministerio de Ciencia, Innovación y Universidades (MCIU) under the grants AYA2016-76682-C3 and PID2019-106027GB-C41. Authors acknowledge financial support from the State Agency for Research of the Spanish MCIU through the ‘Centre of Excellence Severo Ochoa’ award to the Instituto de Astrofísica de Andalucía (SEV-2017-0709). L.H.M. acknowledge financial support under the grant BES-2017-082471. The data presented here were obtained in part with ALFOSC, which is provided by the Instituto de Astrofísica de Andalucía (IAA) under a joint agreement with the University of Copenhagen and NOTSA. This work is based on observations made with the NASA/ESA Hubble Space Telescope, and obtained from the Hubble Legacy Archive, which is a collaboration between the Space Telescope Science Institute (STScI/NASA), the Space Telescope European Coordinating Facility (ST-ECF/ESA) and the Canadian Astronomy Data Centre (CADC/NRC/CSA). This research has made use of data obtained from the Chandra Data Archive and software provided by the Chandra X-ray Centre in the application package CIAO. This research has made use of the NASA/IPAC Extragalactic Database (NED), which is operated by the Jet Propulsion Laboratory, California Institute of Technology, under contract with the National Aeronautics and Space Administration. We acknowledge the usage of the HyperLeda database (http://leda.univ-lyon1.fr). This work has made extensive use of IRAF (v2.16) and Python (v3.8.10), particularly with ASTROPY (v4.2, http://www.astropy.org; Astropy Collaboration 2013, 2018), MATPLOTLIB (v3.4.1; Hunter 2007), PHOTUTILS (v1.1.0; Bradley et al. 2020) and NUMPY (v1.19.4; Harris et al. 2020). Authors acknowledge M. Guerrero and B. Pérez for their help in some observing runs, and the support astronomers at the NOT telescope that made the observations during service time. The data that support this study are available from the corresponding author, LHM, upon reasonable request.
References
- Afanasiev, V. L., & Silchenko, O. K. 2007, Astron. Astrophys. Trans., 26, 311 [NASA ADS] [CrossRef] [Google Scholar]
- Allard, E. L., Peletier, R. F., & Knapen, J. H. 2005, ApJ, 633, L25 [NASA ADS] [CrossRef] [Google Scholar]
- Arsenault, R., Roy, J. R., & Boulesteix, J. 1990, A&A, 234, 23 [NASA ADS] [Google Scholar]
- Astropy Collaboration (Robitaille, T. P., et al.) 2013, A&A, 558, A33 [NASA ADS] [CrossRef] [EDP Sciences] [Google Scholar]
- Astropy Collaboration (Price-Whelan, A. M., et al.) 2018, AJ, 156, 123 [Google Scholar]
- Bacon, R., Copin, Y., Monnet, G., et al. 2001, MNRAS, 326, 23 [Google Scholar]
- Bae, H. J., Woo, J.-H., Karouzos, M., et al. 2017, ApJ, 837, 91 [NASA ADS] [CrossRef] [Google Scholar]
- Baldi, R. D., Rodríguez Zaurín, J., Chiaberge, M., et al. 2019, ApJ, 870, 53 [CrossRef] [Google Scholar]
- Balmaverde, B., & Capetti, A. 2014, A&A, 563, A119 [NASA ADS] [CrossRef] [EDP Sciences] [Google Scholar]
- Barentine, J. C., & Kormendy, J. 2012, ApJ, 754, 140 [NASA ADS] [CrossRef] [Google Scholar]
- Battaner, E., Mediavilla, E., Guijarro, A., Arribas, S., & Florido, E. 2003, A&A, 401, 67 [NASA ADS] [CrossRef] [EDP Sciences] [Google Scholar]
- Bertola, F., Corsini, E. M., Beltrán, J. C. V., et al. 1999, ApJ, 519, L127 [NASA ADS] [CrossRef] [Google Scholar]
- Bianchi, S., Guainazzi, M., & Chiaberge, M. 2006, A&A, 448, 499 [NASA ADS] [CrossRef] [EDP Sciences] [Google Scholar]
- Bianchi, S., Guainazzi, M., Laor, A., Stern, J., & Behar, E. 2019, MNRAS, 485, 416 [NASA ADS] [CrossRef] [Google Scholar]
- Boardman, N. F., Weijmans, A.-M., van den Bosch, R., et al. 2017, MNRAS, 471, 4005 [NASA ADS] [CrossRef] [Google Scholar]
- Boehle, A., Larkin, J. E., Armus, L., & Wright, S. A. 2018, ApJ, 866, 79 [NASA ADS] [CrossRef] [Google Scholar]
- Boizelle, B. D., Walsh, J. L., Barth, A. J., et al. 2021, ApJ, 908, 19 [NASA ADS] [CrossRef] [Google Scholar]
- Bradley, L., Sipőcz, B., Robitaille, T., et al. 2020, https://doi.org/10.5281/zenodo.4044744 [Google Scholar]
- Braun, R., Oosterloo, T. A., Morganti, R., Klein, U., & Beck, R. 2007, A&A, 461, 455 [NASA ADS] [CrossRef] [EDP Sciences] [Google Scholar]
- Brodie, J. P., Romanowsky, A. J., Strader, J., et al. 2014, ApJ, 796, 52 [Google Scholar]
- Canning, R. E. A., Fabian, A. C., Johnstone, R. M., et al. 2011, MNRAS, 417, 3080 [NASA ADS] [CrossRef] [Google Scholar]
- Carollo, C. M., Franx, M., Illingworth, G. D., & Forbes, D. A. 1997, ApJ, 481, 710 [Google Scholar]
- Carollo, C. M., Stiavelli, M., Seigar, M., de Zeeuw, P. T., & Dejonghe, H. 2002, AJ, 123, 159 [NASA ADS] [CrossRef] [Google Scholar]
- Casasola, V., Hunt, L. K., Combes, F., García-Burillo, S., & Neri, R. 2011, A&A, 527, A92 [NASA ADS] [CrossRef] [EDP Sciences] [Google Scholar]
- Cazzoli, S., Arribas, S., Colina, L., et al. 2014, A&A, 569, A14 [NASA ADS] [CrossRef] [EDP Sciences] [Google Scholar]
- Cazzoli, S., Arribas, S., Maiolino, R., & Colina, L. 2016, A&A, 590, A125 [NASA ADS] [CrossRef] [EDP Sciences] [Google Scholar]
- Cazzoli, S., Márquez, I., Masegosa, J., et al. 2018, MNRAS, 480, 1106 [Google Scholar]
- Cazzoli, S., Gil de Paz, A., Márquez, I., et al. 2020, MNRAS, 493, 3656 [NASA ADS] [CrossRef] [Google Scholar]
- Cepa, J., & Beckman, J. E. 1990, A&AS, 83, 211 [NASA ADS] [Google Scholar]
- Chemin, L., Balkowski, C., Cayatte, V., et al. 2006, MNRAS, 366, 812 [NASA ADS] [CrossRef] [Google Scholar]
- Chiaraluce, E., Bruni, G., Panessa, F., et al. 2019, MNRAS, 485, 3185 [NASA ADS] [CrossRef] [Google Scholar]
- Cicone, C., Maiolino, R., Sturm, E., et al. 2014, A&A, 562, A21 [NASA ADS] [CrossRef] [EDP Sciences] [Google Scholar]
- Combes, F., Young, L. M., & Bureau, M. 2007, MNRAS, 377, 1795 [NASA ADS] [CrossRef] [Google Scholar]
- Concas, A., Popesso, P., Brusa, M., Mainieri, V., & Thomas, D. 2019, A&A, 622, A188 [NASA ADS] [CrossRef] [EDP Sciences] [Google Scholar]
- Corsini, E. M., Méndez-Abreu, J., Pastorello, N., et al. 2012, MNRAS, 423, L79 [NASA ADS] [CrossRef] [Google Scholar]
- Corsini, E. M., Morelli, L., Zarattini, S., et al. 2018, A&A, 618, A172 [NASA ADS] [CrossRef] [EDP Sciences] [Google Scholar]
- Cortés, J. R., Kenney, J. D. P., & Hardy, E. 2015, ApJS, 216, 9 [Google Scholar]
- Cresci, G., & Maiolino, R. 2018, Nat. Astron., 2, 179 [Google Scholar]
- Dahmer-Hahn, L. G., Riffel, R., Ricci, T. V., et al. 2019, MNRAS, 489, 5653 [NASA ADS] [CrossRef] [Google Scholar]
- Davis, T. A., & McDermid, R. M. 2017, MNRAS, 464, 453 [NASA ADS] [CrossRef] [Google Scholar]
- Davies, R. I., Maciejewski, W., Hicks, E. K. S., et al. 2014, ApJ, 792, 101 [Google Scholar]
- Davies, R., Baron, D., Shimizu, T., et al. 2020, MNRAS, 498, 4150 [Google Scholar]
- Díaz-García, S., Moyano, F. D., Comerón, S., et al. 2020, A&A, 644, A38 [NASA ADS] [CrossRef] [EDP Sciences] [Google Scholar]
- Dopita, M. A., & Sutherland, R. S. 1995, ApJ, 455, 468 [Google Scholar]
- Dopita, M. A., Ho, I.-T., Dressel, L. L., et al. 2015, ApJ, 801, 42 [NASA ADS] [CrossRef] [Google Scholar]
- Dullo, B. T., Martínez-Lombilla, C., & Knapen, J. H. 2016, MNRAS, 462, 3800 [NASA ADS] [CrossRef] [Google Scholar]
- Emsellem, E., Cappellari, M., Peletier, R. F., et al. 2004, MNRAS, 352, 721 [Google Scholar]
- Ene, I., Ma, C.-P., Veale, M., et al. 2018, MNRAS, 479, 2810 [Google Scholar]
- Ene, I., Ma, C.-P., Walsh, J. L., et al. 2020, ApJ, 891, 65 [NASA ADS] [CrossRef] [Google Scholar]
- Epinat, B., Amram, P., & Marcelin, M. 2008, MNRAS, 390, 466 [NASA ADS] [Google Scholar]
- Erroz-Ferrer, S., Knapen, J. H., Mohd Noh Velastín, E. A. N., Ryon, J. E., & Hagen, L. M. Z. 2013, MNRAS, 436, 3135 [NASA ADS] [CrossRef] [Google Scholar]
- Erwin, P., & Debattista, V. P. 2017, MNRAS, 468, 2058 [Google Scholar]
- Erwin, P., & Sparke, L. S. 1999, ApJ, 521, L37 [NASA ADS] [CrossRef] [Google Scholar]
- Erwin, P., Pohlen, M., & Beckman, J. E. 2008, AJ, 135, 20 [Google Scholar]
- Eskridge, P. B., & Pogge, R. W. 1997, ApJ, 486, 259 [NASA ADS] [CrossRef] [Google Scholar]
- Fabbiano, G., Heckman, T., & Keel, W. C. 1990, ApJ, 355, 442 [NASA ADS] [CrossRef] [Google Scholar]
- Fabian, A. C. 2012, ARA&A, 50, 455 [Google Scholar]
- Falcón-Barroso, J., Balcells, M., Peletier, R. F., & Vazdekis, A. 2003, A&A, 405, 455 [NASA ADS] [CrossRef] [EDP Sciences] [Google Scholar]
- Falcón-Barroso, J., Bacon, R., Bureau, M., et al. 2006, MNRAS, 369, 529 [Google Scholar]
- Filho, M. E., Barthel, P. D., & Ho, L. C. 2002, ApJS, 142, 223 [NASA ADS] [CrossRef] [Google Scholar]
- Finkelman, I., Brosch, N., Funes, J. G., Kniazev, A. Y., & Väisänen, P. 2010, MNRAS, 407, 2475 [NASA ADS] [CrossRef] [Google Scholar]
- Fiore, F., Feruglio, C., Shankar, F., et al. 2017, A&A, 601, A143 [NASA ADS] [CrossRef] [EDP Sciences] [Google Scholar]
- Fischer, T. C., Crenshaw, D. M., Kraemer, S. B., & Schmitt, H. R. 2013, ApJS, 209, 1 [Google Scholar]
- Fluetsch, A., Maiolino, R., Carniani, S., et al. 2019, MNRAS, 483, 4586 [NASA ADS] [Google Scholar]
- Fluetsch, A., Maiolino, R., Carniani, S., et al. 2021, MNRAS, 505, 5753 [NASA ADS] [CrossRef] [Google Scholar]
- Forbes, D. A. 1996, AJ, 112, 1409 [NASA ADS] [CrossRef] [Google Scholar]
- Foster, C., Spitler, L. R., Romanowsky, A. J., et al. 2011, MNRAS, 415, 3393 [NASA ADS] [CrossRef] [Google Scholar]
- Garcia-Burillo, S., Sempere, M. J., Combes, F., & Neri, R. 1998, A&A, 333, 864 [Google Scholar]
- García-Burillo, S., Fernández-García, S., Combes, F., et al. 2009, A&A, 496, 85 [NASA ADS] [CrossRef] [EDP Sciences] [Google Scholar]
- Gerssen, J., Kuijken, K., & Merrifield, M. R. 1999, MNRAS, 306, 926 [NASA ADS] [CrossRef] [Google Scholar]
- González Delgado, R. M., Pérez, E., Cid Fernandes, R., & Schmitt, H. 2008, AJ, 135, 747 [CrossRef] [Google Scholar]
- González-Martín, O., Masegosa, J., Márquez, I., Guainazzi, M., & Jiménez-Bailón, E. 2009a, A&A, 506, 1107 [NASA ADS] [CrossRef] [EDP Sciences] [Google Scholar]
- González-Martín, O., Masegosa, J., Márquez, I., & Guainazzi, M. 2009b, ApJ, 704, 1570 [CrossRef] [Google Scholar]
- Goudfrooij, P., Hansen, L., Jorgensen, H. E., & Norgaard-Nielsen, H. U. 1994a, A&AS, 105, 341 [NASA ADS] [Google Scholar]
- Goudfrooij, P., Hansen, L., Jorgensen, H. E., et al. 1994b, A&AS, 104, 179 [NASA ADS] [Google Scholar]
- Hameed, S., & Devereux, N. 2005, AJ, 129, 2597 [NASA ADS] [CrossRef] [Google Scholar]
- Harris, C. R., Millman, K. J., van der Walt, S. J., et al. 2020, Nature, 585, 357 [NASA ADS] [CrossRef] [Google Scholar]
- Harrison, C. M., Alexander, D. M., Mullaney, J. R., et al. 2016, MNRAS, 456, 1195 [Google Scholar]
- Haynes, M. P., Jore, K. P., Barrett, E. A., Broeils, A. H., & Murray, B. M. 2000, AJ, 120, 703 [Google Scholar]
- Heckman, T. M. 1980, A&A, 87, 152 [Google Scholar]
- Hermosa Muñoz, L., Cazzoli, S., Márquez, I., & Masegosa, J. 2020, A&A, 635, A50 [EDP Sciences] [Google Scholar]
- Ho, L. C. 2008, ARA&A, 46, 475 [Google Scholar]
- Ho, L. C., Filippenko, A. V., & Sargent, W. L. W. 1997, ApJS, 112, 315 [NASA ADS] [CrossRef] [Google Scholar]
- Hunter, J. D. 2007, Comput. Sci. Eng., 9, 90 [NASA ADS] [CrossRef] [Google Scholar]
- James, P. A., & Percival, S. M. 2016, MNRAS, 457, 917 [Google Scholar]
- Józsa, G. I. G., Oosterloo, T. A., Morganti, R., Klein, U., & Erben, T. 2009, A&A, 494, 489 [NASA ADS] [CrossRef] [EDP Sciences] [Google Scholar]
- Kaneda, H., Ishihara, D., Onaka, T., et al. 2011, PASJ, 63, 601 [NASA ADS] [CrossRef] [Google Scholar]
- Katkov, I. Y., Moiseev, A. V., & Sil’chenko, O. K. 2011, ApJ, 740, 83 [NASA ADS] [CrossRef] [Google Scholar]
- Kent, S. M. 1990, AJ, 100, 377 [NASA ADS] [CrossRef] [Google Scholar]
- Knapen, J. H., Cepa, J., Beckman, J. E., Soledad del Rio, M., & Pedlar, A. 1993, ApJ, 416, 563 [NASA ADS] [CrossRef] [Google Scholar]
- Knapen, J. H., Shlosman, I., Heller, C. H., et al. 2000, ApJ, 528, 219 [NASA ADS] [CrossRef] [Google Scholar]
- Koopmann, R. A., & Kenney, J. D. P. 2006, ApJS, 162, 97 [NASA ADS] [CrossRef] [Google Scholar]
- Koopmann, R. A., Kenney, J. D. P., & Young, J. 2001, ApJS, 135, 125 [NASA ADS] [CrossRef] [Google Scholar]
- Kormendy, J. 1979, ApJ, 227, 714 [Google Scholar]
- Kormendy, J. 1984, ApJ, 287, 577 [Google Scholar]
- Kormendy, J., & Ho, L. C. 2013, ARA&A, 51, 511 [Google Scholar]
- Krajnović, D., Weilbacher, P. M., Urrutia, T., et al. 2015, MNRAS, 452, 2 [Google Scholar]
- Kuo, C.-Y., Lim, J., Tang, Y.-W., & Ho, P. T. P. 2008, ApJ, 679, 1047 [NASA ADS] [CrossRef] [Google Scholar]
- Lakhchaura, K., Werner, N., Sun, M., et al. 2018, MNRAS, 481, 4472 [NASA ADS] [CrossRef] [Google Scholar]
- Laurikainen, E., & Salo, H. 2017, A&A, 598, A10 [NASA ADS] [CrossRef] [EDP Sciences] [Google Scholar]
- Laurikainen, E., Salo, H., Buta, R., & Knapen, J. H. 2011, MNRAS, 418, 1452 [Google Scholar]
- Leroy, A. K., Walter, F., Martini, P., et al. 2015, ApJ, 814, 83 [Google Scholar]
- Leroy, A. K., Schinnerer, E., Hughes, A., et al. 2021, ApJS, 257, 43 [NASA ADS] [CrossRef] [Google Scholar]
- Li, J.-T. 2015, MNRAS, 453, 1062 [NASA ADS] [CrossRef] [Google Scholar]
- López-Cobá, C., Sánchez, S. F., Anderson, J. P., et al. 2020, AJ, 159, 167 [Google Scholar]
- Luo, R., Woo, J.-H., Karouzos, M., et al. 2021, ApJ, 908, 221 [NASA ADS] [CrossRef] [Google Scholar]
- Ma, C.-P., Greene, J. E., McConnell, N., et al. 2014, ApJ, 795, 158 [Google Scholar]
- Márquez, I., & Moles, M. 1996, A&AS, 120, 1 [NASA ADS] [CrossRef] [EDP Sciences] [Google Scholar]
- Márquez, I., Durret, F., González Delgado, R. M., et al. 1999, A&AS, 140, 1 [NASA ADS] [CrossRef] [EDP Sciences] [Google Scholar]
- Márquez, I., Masegosa, J., Durret, F., et al. 2003, A&A, 409, 459 [NASA ADS] [CrossRef] [EDP Sciences] [Google Scholar]
- Márquez, I., Masegosa, J., González-Martin, O., et al. 2017, Front. Astron. Space Sci., 4, 34 [CrossRef] [Google Scholar]
- Masegosa, J., Márquez, I., Ramirez, A., & González-Martín, O. 2011, A&A, 527, A23 [NASA ADS] [CrossRef] [EDP Sciences] [Google Scholar]
- Mazzalay, X., Maciejewski, W., Erwin, P., et al. 2014, MNRAS, 438, 2036 [NASA ADS] [CrossRef] [Google Scholar]
- Mediavilla, E., Arribas, S., García-Lorenzo, B., & del Burgo, C. 1997, ApJ, 488, 682 [NASA ADS] [CrossRef] [Google Scholar]
- Mingozzi, M., Cresci, G., Venturi, G., et al. 2019, A&A, 622, A146 [NASA ADS] [CrossRef] [EDP Sciences] [Google Scholar]
- Moellenhoff, C., & Bender, R. 1989, A&A, 214, 61 [NASA ADS] [Google Scholar]
- Molaeinezhad, A., Falcón-Barroso, J., Martínez-Valpuesta, I., et al. 2016, MNRAS, 456, 692 [NASA ADS] [CrossRef] [Google Scholar]
- Molina, M., Eracleous, M., Barth, A. J., et al. 2018, ApJ, 864, 90 [Google Scholar]
- Morganti, R. 2017, Front. Astron. Space Sci., 4, 42 [CrossRef] [Google Scholar]
- Mosenkov, A., Rich, R. M., Koch, A., et al. 2020, MNRAS, 494, 1751 [NASA ADS] [CrossRef] [Google Scholar]
- Mulcahey, C. R., Prichard, L. J., Krajnović, D., & Jorgenson, R. A. 2021, MNRAS, 504, 5087 [NASA ADS] [CrossRef] [Google Scholar]
- Nemmen, R. S., Storchi-Bergmann, T., & Eracleous, M. 2014, MNRAS, 438, 2804 [Google Scholar]
- Nyland, K., Davis, T. A., Nguyen, D. D., et al. 2017, ApJ, 845, 50 [NASA ADS] [CrossRef] [Google Scholar]
- Osterbrock, D. E., & Ferland, G. J. 2006, Astrophysics of Gaseous Nebulae and Active Galactic Nuclei, 2nd edn. (Sausalito, CA: University Science Books) [Google Scholar]
- Pagotto, I., Corsini, E. M., Sarzi, M., et al. 2019, MNRAS, 483, 57 [NASA ADS] [CrossRef] [Google Scholar]
- Pandya, V., Greene, J. E., Ma, C.-P., et al. 2017, ApJ, 837, 40 [Google Scholar]
- Peters, W., & Kuzio de Naray, R. 2017, MNRAS, 469, 3541 [NASA ADS] [CrossRef] [Google Scholar]
- Pignatelli, E., Corsini, E. M., Vega Beltrán, J. C., et al. 2001, MNRAS, 323, 188 [NASA ADS] [CrossRef] [Google Scholar]
- Pogge, R. W., Maoz, D., Ho, L. C., & Eracleous, M. 2000, ApJ, 532, 323 [NASA ADS] [CrossRef] [Google Scholar]
- Pu, S. B., Saglia, R. P., Fabricius, M. H., et al. 2010, A&A, 516, A4 [NASA ADS] [CrossRef] [EDP Sciences] [Google Scholar]
- Raimundo, S. I. 2021, A&A, 650, A34 [NASA ADS] [CrossRef] [EDP Sciences] [Google Scholar]
- Ramos Almeida, C., & Ricci, C. 2017, Nat. Astron., 1, 679 [Google Scholar]
- Randall, S. W., Forman, W. R., Giacintucci, S., et al. 2011, ApJ, 726, 86 [NASA ADS] [CrossRef] [Google Scholar]
- Randall, S. W., Nulsen, P. E. J., Jones, C., et al. 2015, ApJ, 805, 112 [NASA ADS] [CrossRef] [Google Scholar]
- Rest, A., van den Bosch, F. C., Jaffe, W., et al. 2001, AJ, 121, 2431 [NASA ADS] [CrossRef] [Google Scholar]
- Revalski, M., Meena, B., Martinez, F., et al. 2021, ApJ, 910, 139 [NASA ADS] [CrossRef] [Google Scholar]
- Ricci, T. V., Steiner, J. E., & Menezes, R. B. 2014, MNRAS, 440, 2419 [NASA ADS] [CrossRef] [Google Scholar]
- Ricci, T. V., Steiner, J. E., & Menezes, R. B. 2015, MNRAS, 451, 3728 [NASA ADS] [CrossRef] [Google Scholar]
- Roy, A., Nath, B. B., Sharma, P., & Shchekinov, Y. 2016, MNRAS, 463, 2296 [NASA ADS] [CrossRef] [Google Scholar]
- Ruschel-Dutra, D., Storchi-Bergmann, T., Schnorr-Müller, A., et al. 2021, MNRAS, 507, 74 [NASA ADS] [CrossRef] [Google Scholar]
- Sakamoto, K., Okumura, S., Minezaki, T., Kobayashi, Y., & Wada, K. 1995, AJ, 110, 2075 [NASA ADS] [CrossRef] [Google Scholar]
- Sánchez, S. F., Walcher, C. J., Lopez-Cobá, C., et al. 2021, Rev. Mex. Astron. Astrofis., 57, 3 [Google Scholar]
- Sánchez-Gallego, J. R., Knapen, J. H., Wilson, C. D., et al. 2012, MNRAS, 422, 3208 [CrossRef] [Google Scholar]
- Sarzi, M., Falcón-Barroso, J., Davies, R. L., et al. 2006, MNRAS, 366, 1151 [Google Scholar]
- Sarzi, M., Shields, J. C., Schawinski, K., et al. 2010, MNRAS, 402, 2187 [Google Scholar]
- Scarlata, C., Stiavelli, M., Hughes, M. A., et al. 2004, AJ, 128, 1124 [NASA ADS] [CrossRef] [Google Scholar]
- Schmidt, T. M., Bigiel, F., Klessen, R. S., & de Blok, W. J. G. 2016, MNRAS, 457, 2642 [NASA ADS] [CrossRef] [Google Scholar]
- Shapiro, K. L., Cappellari, M., de Zeeuw, T., et al. 2006, MNRAS, 370, 559 [NASA ADS] [Google Scholar]
- Sharp, R. G., & Bland-Hawthorn, J. 2010, ApJ, 711, 818 [Google Scholar]
- Storchi-Bergmann, T., Schimoia, J. S., Peterson, B. M., et al. 2017, ApJ, 835, 236 [Google Scholar]
- Trinchieri, G., Pellegrini, S., Fabbiano, G., et al. 2008, ApJ, 688, 1000 [NASA ADS] [CrossRef] [Google Scholar]
- Tsai, A.-L., Matsushita, S., Kong, A. K. H., Matsumoto, H., & Kohno, K. 2012, ApJ, 752, 38 [NASA ADS] [CrossRef] [Google Scholar]
- Ulrich, M.-H. 1975, PASP, 87, 965 [NASA ADS] [CrossRef] [Google Scholar]
- van den Bosch, F. C., Ferrarese, L., Jaffe, W., Ford, H. C., & O’Connell, R. W. 1994, AJ, 108, 1579 [NASA ADS] [CrossRef] [Google Scholar]
- Veilleux, S., Cecil, G., & Bland-Hawthorn, J. 2005, ARA&A, 43, 769 [NASA ADS] [CrossRef] [Google Scholar]
- Veilleux, S., Maiolino, R., Bolatto, A. D., & Aalto, S. 2020, A&ARv, 28, 2 [NASA ADS] [CrossRef] [Google Scholar]
- Walsh, J. L., Barth, A. J., Ho, L. C., et al. 2008, AJ, 136, 1677 [NASA ADS] [CrossRef] [Google Scholar]
- Watkins, A. E., Mihos, J. C., Harding, P., & Feldmeier, J. J. 2014, ApJ, 791, 38 [Google Scholar]
- Wild, V., Rosales-Ortega, F., Falcón-Barroso, J., et al. 2014, A&A, 567, A132 [NASA ADS] [CrossRef] [EDP Sciences] [Google Scholar]
- Wilson, C. D., Cridland, A., Foyle, K., et al. 2013, ApJ, 776, L30 [NASA ADS] [CrossRef] [Google Scholar]
- Yıldız, M. K., Peletier, R. F., Duc, P. A., & Serra, P. 2020, A&A, 636, A8 [EDP Sciences] [Google Scholar]
- Young, L. M., Bureau, M., & Cappellari, M. 2008, ApJ, 676, 317 [NASA ADS] [CrossRef] [Google Scholar]
Appendix A: Individual comments on galaxies
NGC 0266 (see Fig. B.1): The Hα emission of this barred galaxy was studied by Epinat et al. (2008). These authors obtained the velocity maps with data from the GHASP survey, finding gas with disturbed morphology, that could be consistent with past interactions. Considering all the regions with Hα emission of NGC 0266 (out to ∼2′), we only find emission along the spiral arms and extended in the centre (see upper panel of Fig. B.1). Epinat et al. (2008) detected additional gas distributed along the major axis of the galaxy, following the spiral arms but also randomly distributed, with large voids of gas near the centre.
NGC 0410 (see Fig. B.1): It belongs to a small group of galaxies together with NGC 0407 and NGC 0414 (non-active systems). We have classified the emission of this object as Core-halo (see Table 1). No extended Hα emission has been reported previously (Lakhchaura et al. 2018). This galaxy is also included in the MASSIVE survey (Ma et al. 2014), but only the stellar kinematics are shown (Ene et al. 2020).
NGC 0841 (see Fig. B.1): González Delgado et al. (2008) characterised this galaxy as hosting a nuclear spiral and a dust lane using F547M HST imaging. Our sharp-divided image also suggests a ring-like nuclear structure. The Hα image shows strong emission in the nucleus and clumpy emission regions along the disk, probably associated with multiple star-forming regions. Thus, we classified it as Disky. The HI data of this system show a perturbed morphology indicative of its interaction with NGC 0834 (not in this sample), located south-east of our galaxy, although both systems are optically undisturbed (Kuo et al. 2008). The ionised and neutral gas of this galaxy follow a rotation pattern (Cazzoli et al. 2018).
NGC 2685 (see Fig. B.1): This galaxy shows a complex structure, hosting an inner polar ring and an outer ring, thought to correspond to a warped disk, oriented as the galaxy disk (Józsa et al. 2009). The H I gas morphology is disturbed with the presence of non-circular motions (likely due to the interaction between these two different rings), although its rotation curve is nearly that of a spiral (Józsa et al. 2009). Boardman et al. (2017) studied the [O III] kinematics for this galaxy within the ATLAS3D survey, finding a disturbed velocity map, probably ascribed to gas accretion. In Hermosa Muñoz et al. (2020) the long-slit spectrum analysed shows very narrow line profiles (σ ∼ 65 km s−1) in both space- and ground-based spectra, although neither was oriented in the direction in which we see an extended ionised emission (PA∼120°; see middle lower panel in Fig. B.1). This asymmetric emission coming from the nucleus, extending up to 10 arcsec, was also found by Ulrich (1975) using long-slit spectroscopy around the [O II]λ3727 Å line. Eskridge & Pogge (1997) obtained optical spectroscopy to study the H II regions of the galaxy and Hα imaging data where they traced the nuclear emission, stating that the asymmetry is probably due to extinction effects. In our work we ascribe this emission to the possible presence of an outflow, probably not detected kinematically due to the orientation of the slit (e.g. PA = 38° and 54° in Hermosa Muñoz et al. 2020).
NGC 3185 (see Fig. B.2): We have classified the ionised gas emission of this galaxy as Disky, with a clear unresolved nuclear structure that was proposed as a ring in several works (James & Percival 2016; Laurikainen & Salo 2017), coincident with the radio emission in Chiaraluce et al. (2019). In these works the nature of the ring is ascribed to a bar that drives star formation in the nucleus. Laurikainen & Salo (2017) also supports that view, finding an X-shape in their image that is usually present in barred galaxies. On the contrary, Díaz-García et al. (2020) define the nuclear enhanced star-forming region not as a ring, but as a circumnuclear starburst for NGC 3185.
NGC 3379 (see Fig. B.2): We have classified the ionised gas in this galaxy as Bubble as we found evidence of extended Hα emission with an elongated shape in the innermost parts of the image (∼4″). This substructure (PA∼41°) is spatially coincident with a nuclear dust lane at a PA∼50° (Masegosa et al. 2011). Watkins et al. (2014) also found extended emission when studying this galaxy. The Hα emission shows no particular asymmetric structures and no evidence of any previous merger interactions. When they apply an elliptical fitting to the brightness profile, their residuals are X-shaped, just as seen in our SD image (see Fig. B.2), usually present in barred systems. Trinchieri et al. (2008) discovered the presence of outflowing emission near the centre with a width of ∼800 pc (larger than the apparent width in our Hα image ∼300 pc) with deep soft X-ray Chandra observations. Using kinematic data, Shapiro et al. (2006) obtained information within the SAURON sample of the stellar and gaseous component of this galaxy. They found a regularly rotating gas disk and also evidence of non-rotational motions.
NGC 3414 (see Fig. B.2): This is a peculiar S0 galaxy, with a faint disk over a prominent bulge (Koopmann & Kenney 2006). In our images the Hα morphology is classified as a Bubble. Our results show the nuclear emission with a non-symmetric shape that could be due to the presence of dust in the south-west direction, as previously reported. Specifically, the analysis in the R band with HST data done by Rest et al. (2001) suggests the presence of dust in the nucleus. This is also confirmed by Koopmann & Kenney (2006), who found centrally concentrated ionised gas distorted by the presence of dust. Sarzi et al. (2006) studied this galaxy using SAURON data, finding a spiral pattern in the gas distribution that was generally rotating perpendicularly to the stellar component.
NGC 3507 (see Fig. B.2): We have classified the ionised gas morphology of this galaxy as Disky. Previous Hα imaging from the literature (Sánchez-Gallego et al. 2012) trace the large-scale ionised gas distribution that is also seen in our images, but with worse seeing (theirs 1.3″; ours 1.0″). The CO map from the PHANGS-ALMA survey, which provides the CO(2-1) line emission at about 1″ resolution (Leroy et al. 2021), traces molecular gas along the dust lanes seen in the sharp-divided images, broadly resembling the ionised gas emission. A detailed analysis of the CO kinematics would reveal whether the atomic gas is participating from the putative outflow indicated by the Hα morphology.
NGC 3608 (see Fig. B.3): We have classified the Hα morphology of this galaxy as Disky. Similarly, Goudfrooij et al. (1994a) found the distribution of ionised gas to be nearly face-on and symmetric, with no evidence of dust absorption. Afanasiev & Silchenko (2007) found evidence of ionised gas rotating perpendicularly to the stars, with complex stellar kinematics (counter-rotating components). They found no evidence of outflows, although they do see a strong variation in the gas photometric and kinematic major axes at ∼1-4 arcsec from the nucleus that would indicate the presence of polar gas rotation. They claim the existence of a inclined gaseous ring of ∼200 pc, which would be coincident with the inner contours of our Hα image. This galaxy was observed within the ATLAS3D sample, but the weakness of the measured emission lines avoid any kinematical analysis.
NGC 3628 (see Fig. B.3): The nuclear emission in this galaxy is classified as Dusty, given the large amount of dust that prevents us from seeing the galactic centre. At larger scales (up to 100″) Fabbiano et al. (1990) reported for the first time the presence of an outflow in this galaxy, based on Hα observations, reporting that it is coincident with an X-ray plume. This work was later supported by several other studies in other wavelength bands. Specifically, Tsai et al. (2012) reported the existence of a sub-kiloparsec-scale outflow north of the disk, detected with CO(1-0) emission, expanding at 50 km s−1 outwards of the galaxy. This was confirmed by Cicone et al. (2014), who also used molecular gas observations, and they mention that this outflow is spatially coincident with a large-scale plasma outflow (∼10 kpc) that was detected with soft X-ray observations with Chandra. The outflow studied by Tsai et al. (2012) is described as being a weak bubble coming through a central and larger outflow (Roy et al. 2016). Sharp & Bland-Hawthorn (2010) observed this galaxy with the AAOmega IFS, finding filamentary emission and outflowing gas, with evidence of large-scale shocks. We also see signatures of a large-scale outflow in our data, out of the dust lane (up to ∼80″), seen in Fig. 4.
NGC 3642 (see Fig. B.3): As in our image, Pogge et al. (2000) detect a strong nuclear source surrounded by some diffuse circumnuclear Hα emission. We have classified this emission as Disky, concentrated along the spiral arms, with no outflowing signatures. Scarlata et al. (2004) describe the nuclear region of this galaxy as being elongated, probably due to a dust lane, from where dusty spiral arms emerge. The kinematic study performed by Cazzoli et al. (2018) suggest the presence of two kinematic components in the nuclear spectrum, being the broadest component a candidate signature of a nuclear outflow.
NGC 3884 (see Fig. B.3): The Hα morphology of our image shows a rather elongated structure along the galaxy disk (see last row of Fig. B.3); we have classified it as Core-halo. The soft X-ray emission is coincident with the ionised gas (see Fig. 5). Despite the simple distribution of the ionised gas, in Cazzoli et al. (2018) they modelled the emission lines of the ionised gas with two kinematic components. The broadest component is blueshifted and was interpreted as a possible nuclear outflow.
NGC 3898 (see Fig. B.4): In our image we find that the distribution of the Hα gas is extended and Disky. This is consistent with previous works, such as Hameed & Devereux (2005), with data from the CCD imager of the Kitt Peak National Observatory, or Pignatelli et al. (2001), using imaging data from the Vatican Advanced Technology Telescope and spectra from the Isaac Newton Telescope. This latter work found that that the distribution of the ionised gas is smooth within the bulge of the galaxy, but rather clumpy within the disk, due to the presence of H II regions. From this work we can infer from the distribution of these regions that both the gas and stellar components are coincident in the same plane. On the contrary, Carollo et al. (2002) reported an irregular nuclear emission with strong dust component with data from NICMOS/HST. They found red nuclear emission with elongated features, surrounded by a large-scale disk or bar-like structure connected with a spiral feature north-east from the nucleus.
NGC 3945 (see Fig. B.4): In our Hα image we see clear hints of filamentary emission (up to ∼15″), which we have classified as Bubble. This emission could be co-spatial with some internal features mentioned in previous works such as a pseudo-bulge (R∼4″ Kormendy 1979), two bars (R∼2-3″ Erwin & Sparke 1999), or a lens that is coincident with the larger bar (R∼26″ Dullo et al. 2016). Laurikainen et al. (2011) identified the bar lens for the first time oriented along the minor axis of the galaxy; however, Erwin & Debattista (2017) stated that instead that feature seems to be associated with a larger inner or nuclear disk.
NGC 4125 (see Fig. B.4): This elliptical galaxy contains a disk (e.g. van den Bosch et al. 1994; Goudfrooij et al. 1994b) and filamentary nuclear dust (e.g. Goudfrooij et al. 1994a; Braun et al. 2007), visible in our sharp-divided image, which has lead us to a Dusty morphological classification. This galaxy is not detected with radio emission (Filho et al. 2002), or H I or CO gas (Wilson et al. 2013). The soft-X rays are much more extended and not correlated with the ionised gas, which is however correlated with the polycyclic aromatic hydrocarbon (PAH) emission (Kaneda et al. 2011). Pu et al. (2010) obtained the long-slit spectrum of the nucleus, finding evidence of rotation along the major and the minor axes of the galaxy, and young stellar populations in the centre, which could indicate the existence of material coming from a past merger. They found the ionised gas to be oriented along the major axis of the galaxy (as seen in our Hα image), following non-rotational motions, not ascribed to outflows.
NGC 4143 (see Fig. B.4): Our Hα morphology is classified as Unclear, given that the image shows extended emission along the galaxy disk, but part of the gas (or even the whole emission) could be associated with a possible outflow (see Cazzoli et al. 2018). The nuclear spectrum of this galaxy was studied by Cazzoli et al. (2018) based on TWIN/CAHA observations. They found two kinematic components in the ionised gas, with the broadest component consistent with an outflow.
NGC 4203 (see Fig. B.5): The ionised gas morphology in our dataset is classified as Unclear as there is some extended emission that cannot be classified as coming from the disk or from outflowing emission, exclusively from imaging data. Yıldız et al. (2020) characterised the object as a spiral-like, HI-rich, dusty galaxy (their Fig. C.1), and gave an extinction map oriented east–west, in contrast to the north–south orientation of the Hα emission in our image. The nuclear spectrum of this galaxy has complicated profiles with several components (Storchi-Bergmann et al. 2017; Cazzoli et al. 2018). Stellar and gas kinematics from IFU spectroscopy were obtained by Boardman et al. (2017) with the Mitchell spectrograph. The derived gas kinematics, even with sparser spatial resolution, seem to indicate that non-rotational motions, associated with outflows, could be present roughly along the north–south direction.
NGC 4261 (see Fig. B.5): The Hα emission is concentrated near the nucleus, thus we classified it as Core-halo. We find a correlation in the orientation of the soft X-ray emission and the ionised gas, although the first is much more extended (> 15″ from the centre). Baldi et al. (2019) published Hα and [O III] images obtained with HST, showing a notably less extended Hα emission (maximum 3″ vs our ≥5″) and more asymmetric than we find (more emission to the west). Boizelle et al. (2021) used high-resolution (about 0.2″) CO observations with ALMA, finding that the molecular gas extends 2″ on both sides along the north–south axis. The molecular gas kinematics can be globally reproduced by a rotating disk model.
NGC 4278 (see Fig. B.5): This HI-rich (Yıldız et al. 2020), elliptical galaxy hosts a regular disk (Sarzi et al. 2006). The ionised gas morphology is classified here as Core-halo as it is centrally concentrated (see also Masegosa et al. 2011). In Cazzoli et al. (2018) the emission lines of the nuclear spectrum show two kinematic components, one of them consistent with an inflow.
NGC 4321 (see Fig. B.5): This galaxy has been studied in different wavelength bands. Specifically, the ionised gas emission (e.g. Arsenault et al. 1990; Cepa & Beckman 1990; Knapen et al. 2000), the molecular gas (e.g. Sakamoto et al. 1995; Garcia-Burillo et al. 1998), and the HI emission coincident with the optical disk (Knapen et al. 1993). Our Hα morphological image is classified as Disky as it clearly follows the disk of the galaxy, the separation of the four spiral arms, and several star-forming regions (also visible in molecular gas Garcia-Burillo et al. 1998). The central region was analysed with SAURON IFS data (Allard et al. 2005), which reported an enhancement of the Hβ emission in the ring and two dust lanes at the end of the bar of the galaxy. The existence of dust in the disk plane makes the definition of the spiral arms difficult (Scarlata et al. 2004).
NGC 4450 (see Fig. B.6): This barred spiral galaxy was classified as hosting a truncated star-forming disk at ∼60″ from the nucleus, given the non-continuous Hα emission at large scales (Koopmann et al. 2001; Chemin et al. 2006). In the innermost parts of the galaxy (i.e. 5″ from the centre) we find the Hα emission concentrated in a Core-halo morphology. This is in agreement with the image on Koopmann et al. (2001), where the nuclear emission is not extended further out to the galaxy (< 10″), except for some sparse regions at larger scales (∼30″, i.e. ∼3 kpc). Cortés et al. (2015) obtained the velocity field for this galaxy, finding two plateaus at a distance ∼5″ from the centre, that suggested the presence of an additional rotating component. The [O III] emission has an offset of 25° with respect to the main stellar component that was ascribed to the recent acquisition of gas into the galaxy (Cortés et al. 2015). This additional component has also been confirmed by Cazzoli et al. (2018), who detected a secondary component in the forbidden lines, although it was interpreted as outflows/inflows.
NGC 4457 (see Fig. B.6): This face-on galaxy has many star-forming regions, clearly visible in our Hα image (classified as Disky), found only in the inner 30″ (Cortés et al. 2015). This galaxy is known to host a radio jet, although the PA is not reported in the literature (see Nemmen et al. 2014, and references therein). Both the stellar and the ionised gas components are rotating, but non-circular motions have been detected. This is seen in the gas velocity map, which is more disturbed than that of the stars, especially along the stellar kinematic minor axis (Cortés et al. 2015). In our image an Hα arm is clearly visible in the approaching side of the galaxy, as in previous works (Chemin et al. 2006; Cortés et al. 2015). The gas kinematic centre has the most highly blueshifted velocities (Chemin et al. 2006), and its centre is not spatially coincident with the stellar kinematic centre (Cortés et al. 2015). In the work by Cortés et al. (2015), they suggest that the arm and the velocity maps of the ionised gas component are indicative of ram pressure stripping effects.
NGC 4459 (see Fig. B.6): This unbarred lenticular galaxy has an extended dust disk up to ∼8″ from the nucleus (Pagotto et al. 2019, and references therein). The ionised gas morphology is classified here as Bubble as it shows two small blobs south from the nucleus in the direction of the molecular gas kinematic minor axis (Young et al. 2008). The blobs are not seen in previous kinematic maps of the ionised gas (Hβ line in Sarzi et al. 2006). The Hα emission is extended up to ∼10″ from the nucleus in the west–east direction (in agreement with Koopmann et al. 2001) concentrated in a disk, as is the Hβ emission (Sarzi et al. 2006, 2010). Various works have studied the molecular gas traced by the CO in the galaxy (Combes et al. 2007; Young et al. 2008; Davis & McDermid 2017), which is detected along an oval shape, similar to that of the Hα, coincident with dust lanes (visible in our sharp-divided image, see right panel in Fig. B.6, third image from top). The concentrated molecular gas suggests the existence of ongoing circumnuclear star formation (Sarzi et al. 2006). The kinematic information of the CO (2-1) suggests a regular rotating disk (Davis & McDermid 2017).
NGC 4494 (see Fig. B.6): This elliptical galaxy is characterised by an inner edge-on dusty ring of star formation (Forbes 1996). To date, our study is the first focused on the ionised gas of this galaxy. In our image the Hα emission shows a Core-halo morphology, extended up to 40″ from the nucleus (with a 3σ detection). Foster et al. (2011) found a double structure in the global kinematics derived from individual globular clusters, which they ascribe to a recent gas-rich merger, although we do not see any feature of this in the ionised gas. The stellar kinematics was further studied within the ATLAS3D survey (Krajnović et al. 2015) and the SLUGGS survey (Brodie et al. 2014), in which they found a regular rotation pattern, particularly flat in the outer parts of the galaxy.
NGC 4589 (see Fig. B.7): The ionised gas in this elliptical galaxy shows a Core-halo morphology with a dust lane along the minor axis also seen in previous works (Moellenhoff & Bender 1989; Goudfrooij et al. 1994a). Moellenhoff & Bender (1989) performed a spectroscopic study of the object that revealed complex gas and stellar kinematics, with gas moving along several position angles. They associated these motions with a previous merger; this event may also have caused the minor-axis dust lane by accretion of external material. The ionised gas is co-spatial with the dust lane as it already settled down, which is consistent with being produced in an old merger (Moellenhoff & Bender 1989).
NGC 4596 (see Fig. B.7): It is a strong barred galaxy (Kent 1990; Gerssen et al. 1999; Laurikainen & Salo 2017) with a faint dust spiral and a compact source in the nucleus (González Delgado et al. 2008). Our image of the Hα emission reveals an outflow morphology, with an asymmetric profile with respect to the nucleus. Falcón-Barroso et al. (2006) studied this galaxy within the SAURON sample (Bacon et al. 2001), mentioning the misalignment in the kinematic and photometric axes of this galaxy, due to a bar. The stellar and gaseous component are aligned, both with a regular rotation pattern. In the SAURON map the Hβ gas is centrally concentrated (Falcón-Barroso et al. 2006), similar to what we see for Hα in our image.
NGC 4698 (see Fig. B.7): Our Hα image has a morphology that we classified as Core-halo. Erroz-Ferrer et al. (2013) included this object in their sample, where they also obtained Hα imaging with ALFOSC/NOT. They were only interested in the double-ring structure seen at large scales, hence a comparison of the nuclear region with the published Hα image is not possible. Bertola et al. (1999) reported that the nuclear disk of gas and stars are rotating perpendicularly with respect to the galaxy main disk, most probably as a result of acquisition of external gas (Corsini et al. 2012). Cortés et al. (2015) spatially studied resolved stellar and ionised gas kinematics, and suggested that this Virgo cluster galaxy is the product of an ancient merger. They also concluded that the ionised gas kinematics (traced with [O III] in the central 5″) is non-planar. In Hermosa Muñoz et al. (2020) the line profiles are narrow (σ ∼ 90 km s−1) for both space- and ground-based spectroscopic data.
NGC 4750 (see Fig. B.7): The Bubble morphology of the Hα gas of this galaxy is correlated with the soft X-ray emission (see Sect. 5.2). Carollo et al. (2002) reported the presence of spiral features emerging from the nucleus, stronger in the north-east direction, using NICMOS/HST images. They found evidence of strong dust features and star formation. In our data, especially in the sharp-divided image, we also detect spiral arms and the presence of dust. However, the gas seems to be outflowing from the nucleus rather than being distributed along the spiral arms, and we do not detect star-forming regions. In Cazzoli et al. (2018) the nuclear spectrum shows features of an outflow (broad component in forbidden lines and narrow Hα). The slit is oriented towards the outflow detected by our imaging data (PA = 231°).
NGC 4772 (see Fig. B.8): The Hα emission of this galaxy is classified here as Core-halo. Haynes et al. (2000) reported a centrally peaked emission surrounded by diffuse gas affected by the presence of a dust lane, coincident with HI gas. They suggest that this galaxy may have gone through a merger that spread the gas throughout the disk. Falcón-Barroso et al. (2006) detected ionised gas with SAURON data that was oriented in the north-west and south-west directions, possibly coming from a ring out of the main galactic plane. However, there could be other interpretations as the main stellar and gas components of this galaxy are known to co-rotate. In our image we detect a nuclear source both in the ionised and soft X-ray emissions that is diffuse and extended for Hα in the same direction as in Falcón-Barroso et al. (2006).
NGC 5077 (see Fig. B.8): In our image the Hα gas seems to follow the galactic spiral arms or disk, thus we classified it as a Disky morphology. The analysis of MUSE IFS data by Raimundo (2021) confirmed the presence of a stellar distinct counter-rotating core with complex gas dynamics. In fact, our Hα distributions are very similar. She reports the discovery of a nuclear outflow, consistent with a hollow cone intersecting the plane of the sky.
NGC 5363 (see Fig. B.8): The galaxy is classified as I0 in the NED database, although the images may contradict this classification due to an inner spiral structure (Finkelman et al. 2010). In our Hα image this internal structure is seen, as in Finkelman et al. (2010), although it is not detected in the R broadband image. This galaxy shows an internal dust lane that obscures the nuclear emission, and extends further out from the nucleus (Finkelman et al. 2010). No outflow/inflow signatures are seen in the sharp-divided image or in the pure Hα image in the nuclear region. However, at larger scales in our image there is extended emission whose nature is not clear. This lead to our classification as Unclear.
NGC 5746 (see Fig. B.8): This is an edge-on quiescent spiral galaxy, with no evidence of recent mergers (Barentine & Kormendy 2012; Mosenkov et al. 2020). Our image shows a heavily obscured nucleus due to a dust lane that prevents us from seeing the nuclear Hα emission. Integral field spectroscopy is reported only for the extraction of the stellar kinematics, from which the presence of a bar is determined (Molaeinezhad et al. 2016; Peters & Kuzio de Naray 2017).
NGC 5813 (see Fig. B.9): The most notable feature of this elliptical is that it hosts a kinematically decoupled core (Kormendy 1984; Krajnović et al. 2015). Carollo et al. (1997) reported the presence of a dust lane along the major axis of the galaxy, stating that the dust itself may be suggesting the existence of the two reported cores. Our image of the ionised gas reveals very extended emission (see Fig. 4) with filamentary structures that resemble an outflow. In previous Hα observations with the Imager on the SOAR telescope, Randall et al. (2011) reported the presence of filaments co-spatial with the radio emission and with cool gas. They also reported that part of the central Hα emission is anti-correlated with some inner X-rays cavities, although we do find a rough correlation with the soft X-ray emission. With MUSE IFU data, Krajnović et al. (2015) identified two counter-rotating components (visible in the emission lines) and a disturbed velocity dispersion in the stellar component. The Hα-[N II] emission revealed the presence of knots and filaments along the polar direction of the galaxy, also visible in our image. Both lines have a uniform velocity dispersion and both approaching and receding velocities with respect to the systemic velocity of the galaxy (Krajnović et al. 2015). The origin of this emission is explained in Krajnović et al. (2015) as being related to the X-ray cavities and the jet activity, due to the interaction of the gas filaments with the plasma, being a gas reservoir of the galaxy rather than an inflow or an outflow. Despite its complex kinematics and its double nucleus, this galaxy is not believed to have gone through a major merger (Randall et al. 2015).
NGC 5838 (see Fig. B.9): This is an inclined lenticular galaxy (i = 72°, see Table C.1), with a thin bar (Molaeinezhad et al. 2016; Laurikainen & Salo 2017) and fast regular disk rotation (Emsellem et al. 2004). There is reported minor axis rotation, probably produced by asymmetry effects in the velocity maps due to the presence of a nuclear dust disk (Falcón-Barroso et al. 2003). This dust disk is subtle, but visible in our broadband image. Our narrowband image prevents us from determining whether the gas is lying in the galaxy disk or, given its asymmetry, is being produced by outflowing processes. Sarzi et al. (2006) found a regular dust disk and a relatively small scale of the gas distribution (maximum extension up to ∼10″ north-east from the nucleus), being Hβ similar to our Hα distribution. These authors remarked its similarity with NGC 4459, both in the gas distribution and in the kinematic maps, whose ionised gas we classified here as Bubble (see individual comments for that galaxy).
NGC 5957 (see Fig. B.9): This galaxy has previous observations with the NOT telescope in the broad R filter, studied in the work by Erwin et al. (2008). However, they could not determine all their properties due to problems with the sky subtraction. Similarly, our observations of this galaxy suffered from poor sky conditions and high clouds (see Sect. 2), which is translated into a flux loss; we cannot state anything about the ionised gas morphology beyond the pure nuclei, due to the low signal-to-noise ratio.
NGC 6482 (see Fig. B.9): This galaxy is the brightest object of its fossil group (Corsini et al. 2018). The ionised gas in our image has a Core-halo morphology. The object was studied in the context of the MASSIVE survey (Ma et al. 2014), were Ene et al. (2018) found a regular rotation pattern in the stellar component, well aligned with the photometric axis. They found that it is one of the galaxies in the sample with the greatest amount of warm gas, extending up to 16 kpc, in contrast to the ionised gas that goes up to 4 kpc. They associated it with cooling flows that may be connected to the X-ray emission in the system (Pandya et al. 2017). Corsini et al. (2018) analysed the stellar and gaseous components of the galaxy via long-slit spectroscopy, finding a young stellar population that may have been produced by a recent merger or AGN feedback processes.
NGC 7331 (see Fig. B.10): This is a highly inclined spiral galaxy (i = 72°, see Table C.1) located in a group along with other four galaxies (NGC 7335, NGC 7336, NGC 7337, and NGC 7340). The Hα gas is asymmetric, resembling an outflow morphology. Mediavilla et al. (1997) studied the ionised gas emission, in particular the [O III] lines, that were modelled with three different components associated with systemic velocity, a blueshifted component, and a redshifted component. They interpret the components as coming from a disk and a shell of gas, although they do not discard the presence of an outflow/inflow. Battaner et al. (2003) suggest the existence of a massive stellar formation ring, through which there is infalling matter into the inner regions of the galaxy. Inflowing and outflowing material in this galaxy were also found using H I data from the THINGS survey (Schmidt et al. 2016).
NGC7743 (see Fig. B.10): We have classified the ionised gas morphology as Core-halo. The analysis of both long-slit and IFS spectroscopic data made by Katkov et al. (2011) lead us to conclude that the ionised gas present several components in the inner 1-2″, one of them probably produced by the interaction of the jet from the AGN with the ambient interstellar medium. This could be related to what we see in our image, that the Hα contours in that regions shows a slightly different orientation than the outer contours (north–south vs north-east–south-west). The H2 velocity field derived from K-band IFS with SINFONI allowed Davies et al. (2014) to conclude that the molecular gas is outflowing from the AGN.
Appendix B: Hα and sharp-divided images
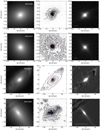 |
Fig. B.1. NOT or HST images of the galaxies in the sample. Left: Original BF image. Middle: Hα image of NGC 0266, NGC 0410, NGC 0841, and NGC 2685 with contours at 3σ (black), 7σ (black), 15σ (black), 25σ (dark purple), 40σ (purple), 60σ (light purple), 80σ (red), 100σ (orange), and 150σ (yellow). Right: Sharp-divided BF image. The blue line indicates the 1 kpc scale. |
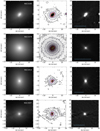 |
Fig. B.2. NGC 3185, NGC 3379, NGC 3414, and NGC 3507 Hα emission. The complete description is in Fig. B.1. |
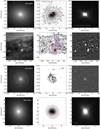 |
Fig. B.3. NGC 3608, NGC 3628, NGC 3642, and NGC 3884 Hα emission. The complete description is in Fig. B.1. |
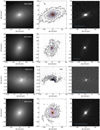 |
Fig. B.4. NGC 3898, NGC 3945, NGC 4125, and NGC 4143 Hα emission. The complete description is in Fig. B.1. |
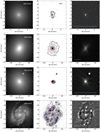 |
Fig. B.5. NGC 4203, NGC 4261, NGC 4278, and NGC 4321 Hα emission. The complete description is in Fig. B.1. |
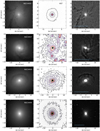 |
Fig. B.6. NGC 4450, NGC 4457, NGC 4459, and NGC 4494 Hα emission. The complete description is in Fig. B.1. |
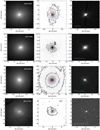 |
Fig. B.7. NGC 4589, NGC 4596, NGC 4698, and NGC 4750 Hα emission. The complete description is in Fig. B.1. |
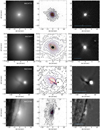 |
Fig. B.8. NGC 4772, NGC 5077, NGC 5363, and NGC 5746 Hα emission. The complete description is in Fig. B.1. |
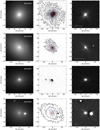 |
Fig. B.9. NGC 5813, NGC 5838, NGC 5957, and NGC 6482 Hα emission. The complete description is in Fig. B.1. |
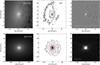 |
Fig. B.10. NGC 7331 and NGC 7743 Hα emission. The complete description is in Fig. B.1. |
Appendix C: Additional tables
General properties for the 70 LINERs used in this paper. The line separates the new observed targets from those selected from Masegosa et al. (2011) and Pogge et al. (2000).
Observing log of HST data.
Observing log of ALFOSC/NOT data.
All Tables
General properties for the 70 LINERs used in this paper. The line separates the new observed targets from those selected from Masegosa et al. (2011) and Pogge et al. (2000).
All Figures
|
Fig. 1. Histogram of the bolometric luminosities (in log units) of the selected sample of LINERs. The luminosities were estimated from González-Martín et al. (2009b) (see Table C.1). The dashed grey line indicates the average value (1041.8 erg s−1). |
| In the text | |
|
Fig. 2. Example of background subtraction process for NGC 6482. Left: original narrowband image of the galaxy. Middle left: mask applied to the original image over imposed to the estimated background. Middle right: final smoothed background. Right: final narrowband image with the corresponding background subtracted. The scale in the left and right panels is approximately the same as the background level to show the differences before and after the subtraction (see Sect. 3 for more details). |
| In the text | |
|
Fig. 3. Examples of the five proposed morphological classifications of the nuclear Hα emission (see Sect. 4). The complete images are in Appendix B. |
| In the text | |
|
Fig. 4. Large-scale Hα images of NGC 3628, NGC 5077, NGC 5363, and NGC 5813. The largest contours indicate the 1σ level over the background signal, except for NGC 5363, where it represents 3σ. The corresponding images on a smaller scale (∼10″ × 10″) with the 3σ detection are shown in Appendix B. |
| In the text | |
|
Fig. 5. Hα images with overlaid contours of the X-ray emission from Chandra. The contour levels are at 3σ (black), 7σ (black), 15σ (black), 25σ (dark purple), 40σ (purple), 60σ (light purple), 80σ (red), 100σ (orange), and 150σ (yellow). |
| In the text | |
|
Fig. 6. Example of the ionised gas emission morphology of NGC 4750 seen with HST and ALFOSC/NOT spatial resolutions. Left: Hα emission observed with HST (M11). Right: smoothed version of the HST image with a Gaussian filter (σ ∼ 5) to match the ALFOSC/NOT resolution. In both panels the minimum contour is 3σ over the background and the maximum is 25σ (in yellow). |
| In the text | |
|
Fig. 7. Histogram of the morphological type of the host galaxy and the classification of the nuclear Hα emission. It is divided into ellipticals (E), spirals (S), and lenticulars (S0); CH stands for Core-halo, Di for Disky, Du for Dusty, and B for Bubble. The purple lines are for the sample from this work, blue for M11, and yellow for the combination of both samples. Unclear cases or irregular galaxies are not included in the figure, and thus the percentages do not sum up 100%. |
| In the text | |
|
Fig. B.1. NOT or HST images of the galaxies in the sample. Left: Original BF image. Middle: Hα image of NGC 0266, NGC 0410, NGC 0841, and NGC 2685 with contours at 3σ (black), 7σ (black), 15σ (black), 25σ (dark purple), 40σ (purple), 60σ (light purple), 80σ (red), 100σ (orange), and 150σ (yellow). Right: Sharp-divided BF image. The blue line indicates the 1 kpc scale. |
| In the text | |
|
Fig. B.2. NGC 3185, NGC 3379, NGC 3414, and NGC 3507 Hα emission. The complete description is in Fig. B.1. |
| In the text | |
|
Fig. B.3. NGC 3608, NGC 3628, NGC 3642, and NGC 3884 Hα emission. The complete description is in Fig. B.1. |
| In the text | |
|
Fig. B.4. NGC 3898, NGC 3945, NGC 4125, and NGC 4143 Hα emission. The complete description is in Fig. B.1. |
| In the text | |
|
Fig. B.5. NGC 4203, NGC 4261, NGC 4278, and NGC 4321 Hα emission. The complete description is in Fig. B.1. |
| In the text | |
|
Fig. B.6. NGC 4450, NGC 4457, NGC 4459, and NGC 4494 Hα emission. The complete description is in Fig. B.1. |
| In the text | |
|
Fig. B.7. NGC 4589, NGC 4596, NGC 4698, and NGC 4750 Hα emission. The complete description is in Fig. B.1. |
| In the text | |
|
Fig. B.8. NGC 4772, NGC 5077, NGC 5363, and NGC 5746 Hα emission. The complete description is in Fig. B.1. |
| In the text | |
|
Fig. B.9. NGC 5813, NGC 5838, NGC 5957, and NGC 6482 Hα emission. The complete description is in Fig. B.1. |
| In the text | |
|
Fig. B.10. NGC 7331 and NGC 7743 Hα emission. The complete description is in Fig. B.1. |
| In the text | |
Current usage metrics show cumulative count of Article Views (full-text article views including HTML views, PDF and ePub downloads, according to the available data) and Abstracts Views on Vision4Press platform.
Data correspond to usage on the plateform after 2015. The current usage metrics is available 48-96 hours after online publication and is updated daily on week days.
Initial download of the metrics may take a while.