Fig. 6.
Download original image
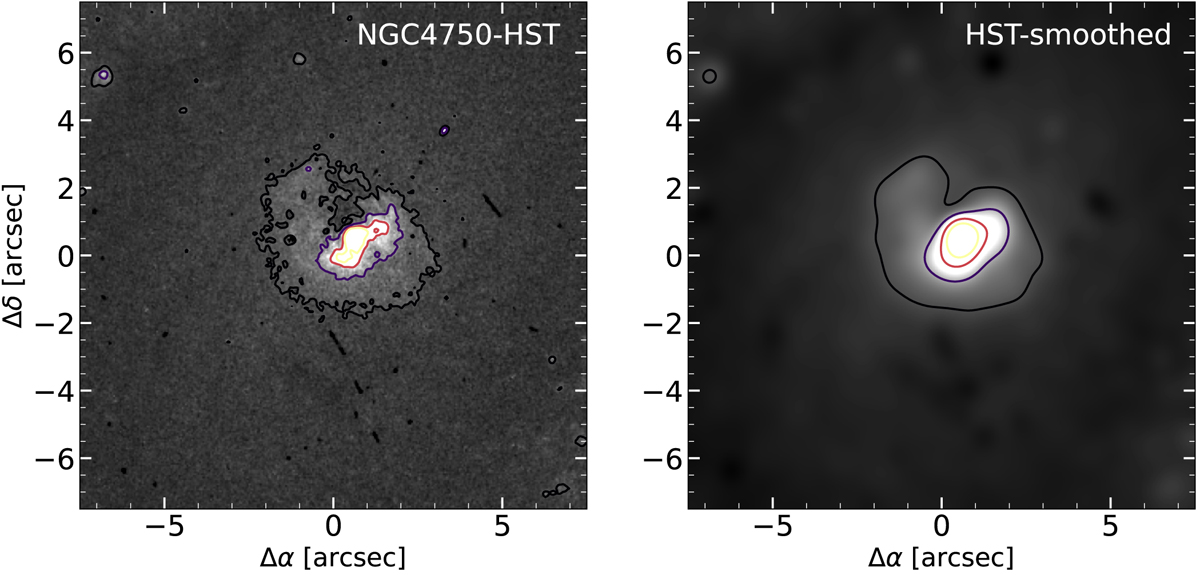
Example of the ionised gas emission morphology of NGC 4750 seen with HST and ALFOSC/NOT spatial resolutions. Left: Hα emission observed with HST (M11). Right: smoothed version of the HST image with a Gaussian filter (σ ∼ 5) to match the ALFOSC/NOT resolution. In both panels the minimum contour is 3σ over the background and the maximum is 25σ (in yellow).
Current usage metrics show cumulative count of Article Views (full-text article views including HTML views, PDF and ePub downloads, according to the available data) and Abstracts Views on Vision4Press platform.
Data correspond to usage on the plateform after 2015. The current usage metrics is available 48-96 hours after online publication and is updated daily on week days.
Initial download of the metrics may take a while.