Fig. 9.
Download original image
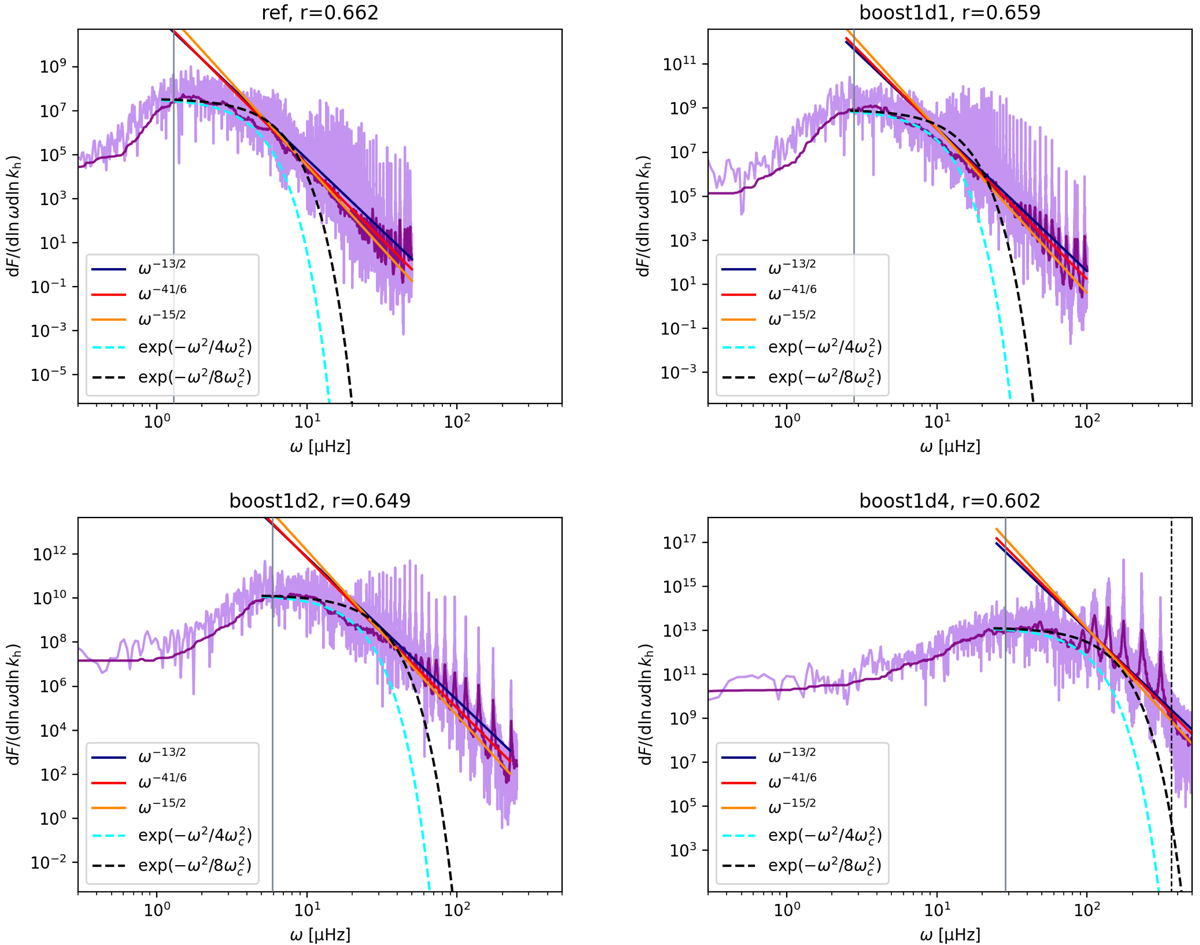
Wave energy flux (light purple line) for the four simulations ref (top left), boost1d1(top right), boost1d2 (bottom left), and boost1d4 (bottom right). The spectra are computed at r = rconv − lmax (i.e. at a distance lmax from the convective boundary) and for angular degree ℓ = 10. The grey vertical lines indicate the convective turnover frequency, ωconv, and the blue, red, and orange lines correspond to functions with slope ω−13/2, ω−41/6, and ω−15/2, respectively. The dashed curves represents two Gaussian spectra with characteristic frequencies ωconv (cyan) and ![]() (black). The dark purple line is a running 25th percentile of the flux over 100 frequency bins.
(black). The dark purple line is a running 25th percentile of the flux over 100 frequency bins.
Current usage metrics show cumulative count of Article Views (full-text article views including HTML views, PDF and ePub downloads, according to the available data) and Abstracts Views on Vision4Press platform.
Data correspond to usage on the plateform after 2015. The current usage metrics is available 48-96 hours after online publication and is updated daily on week days.
Initial download of the metrics may take a while.