Fig. 8.
Download original image
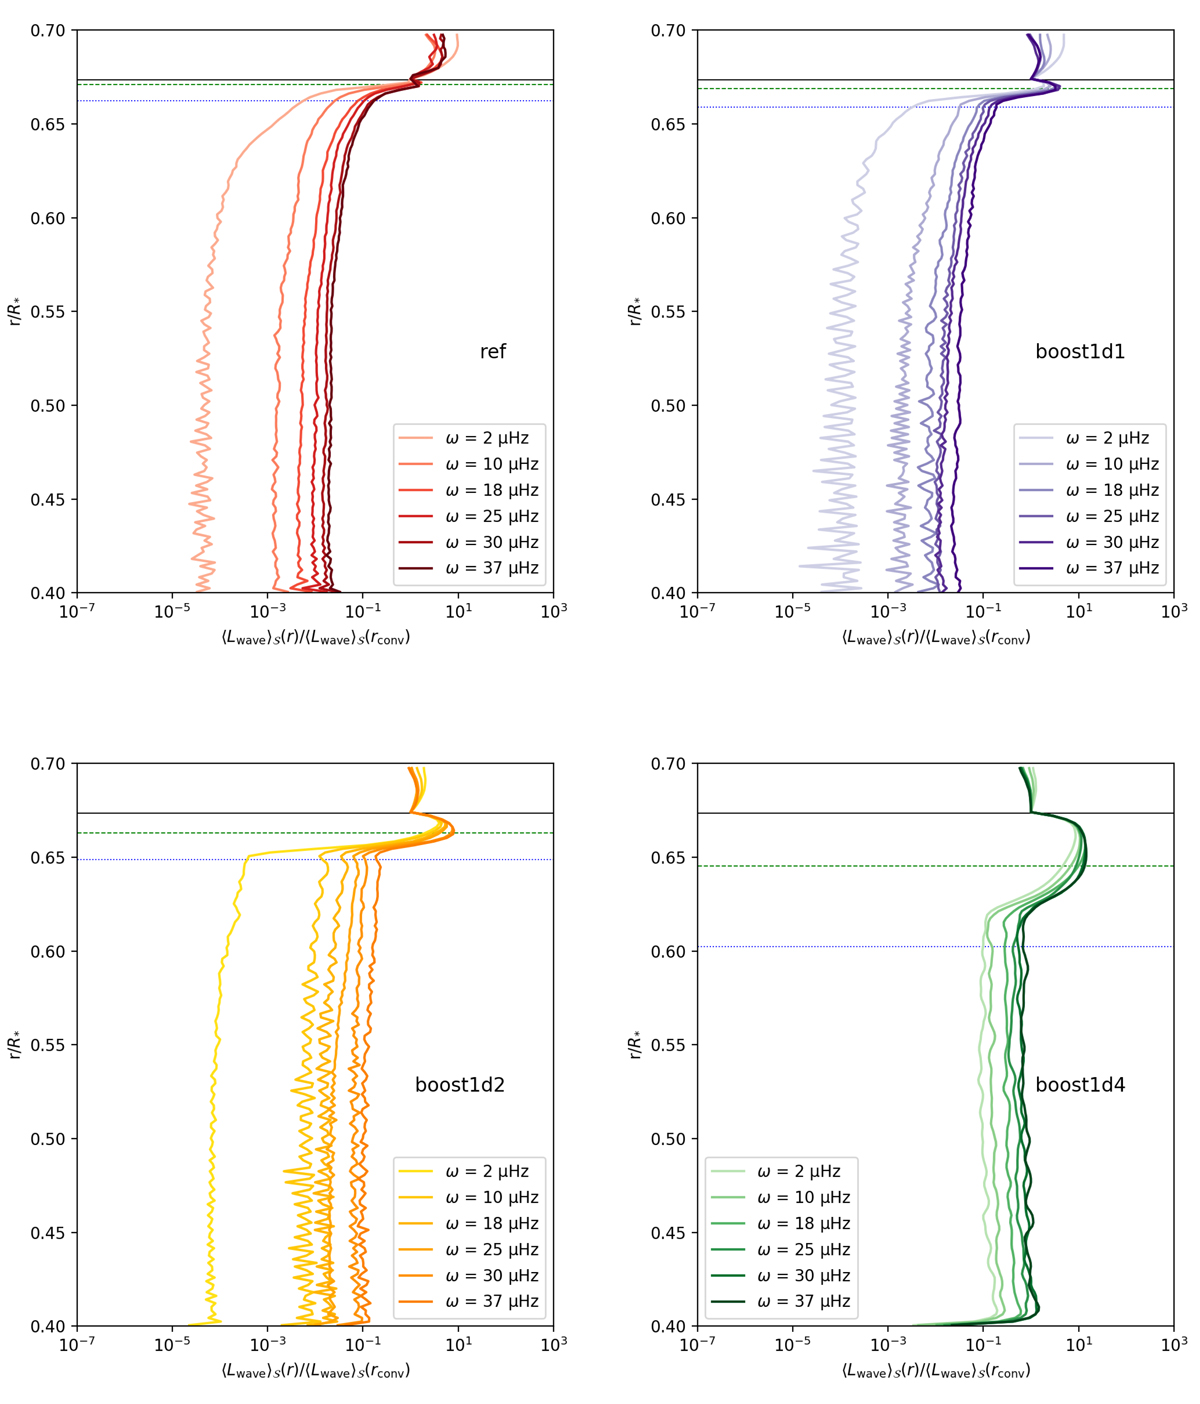
Radial profile of the horizontally averaged luminosity associated with the waves for the four simulations ref (top left), boost1d1 (top right), boost1d2 (bottom left), and boost1d4 (bottom right) at six different frequencies. The power spectra are normalised by their value at the convective boundary, Lwave(rconv). The horizontal solid black line indicates the radiative–convective boundary as defined by the Schwarzschild criterion for the initial model. The horizontal dashed green and dotted blue lines indicate the radii r = rconv − lbulk and r = rconv − lmax, respectively. The horizontal average, ⟨.⟩𝒮, is defined in Eq. (10).
Current usage metrics show cumulative count of Article Views (full-text article views including HTML views, PDF and ePub downloads, according to the available data) and Abstracts Views on Vision4Press platform.
Data correspond to usage on the plateform after 2015. The current usage metrics is available 48-96 hours after online publication and is updated daily on week days.
Initial download of the metrics may take a while.