Free Access
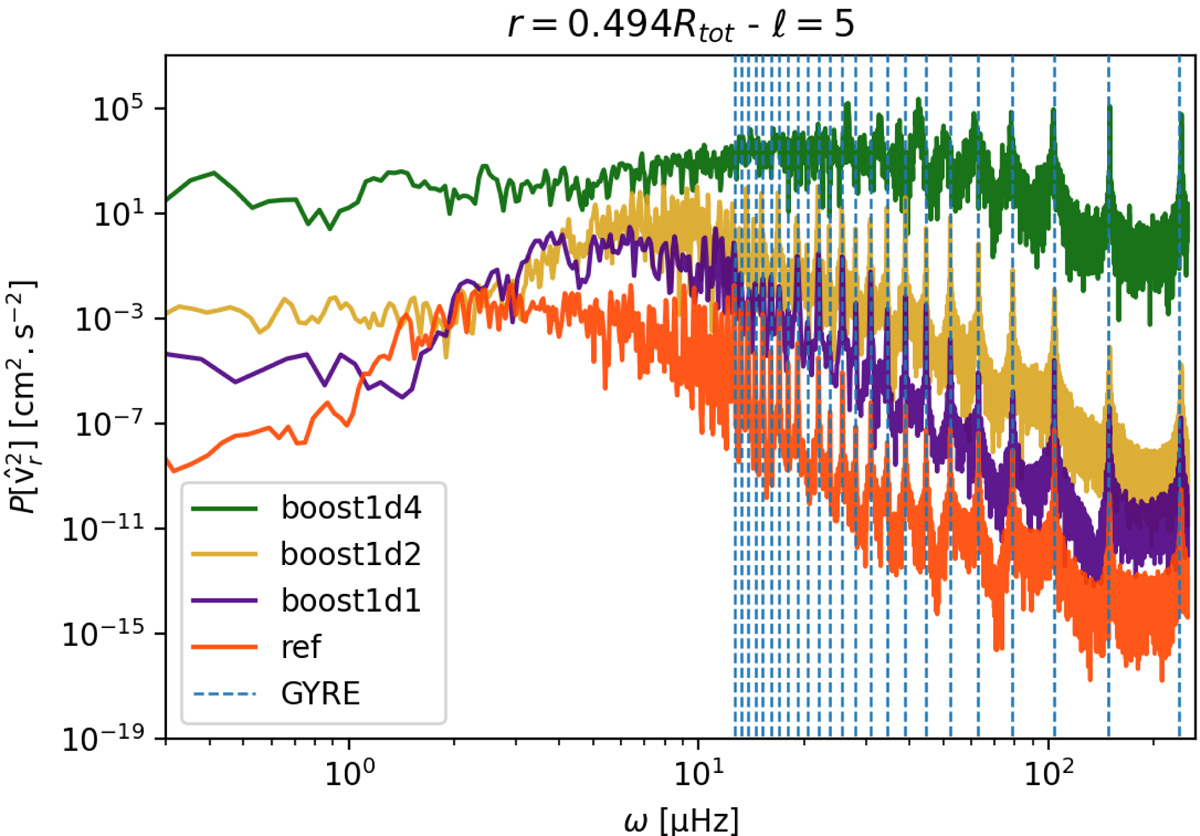
Fig. 6.
Download original image
Power spectrum of the radial velocity as a function of frequency at degree ℓ = 5 for the four simulations ref, boost1d1, boost1d2, and boost1d4 at depth r = 0.494Rtot ≃ rconv − 2HP, conv. The vertical dashed blue lines correspond to g-mode frequencies predicted by GYRE.
Current usage metrics show cumulative count of Article Views (full-text article views including HTML views, PDF and ePub downloads, according to the available data) and Abstracts Views on Vision4Press platform.
Data correspond to usage on the plateform after 2015. The current usage metrics is available 48-96 hours after online publication and is updated daily on week days.
Initial download of the metrics may take a while.