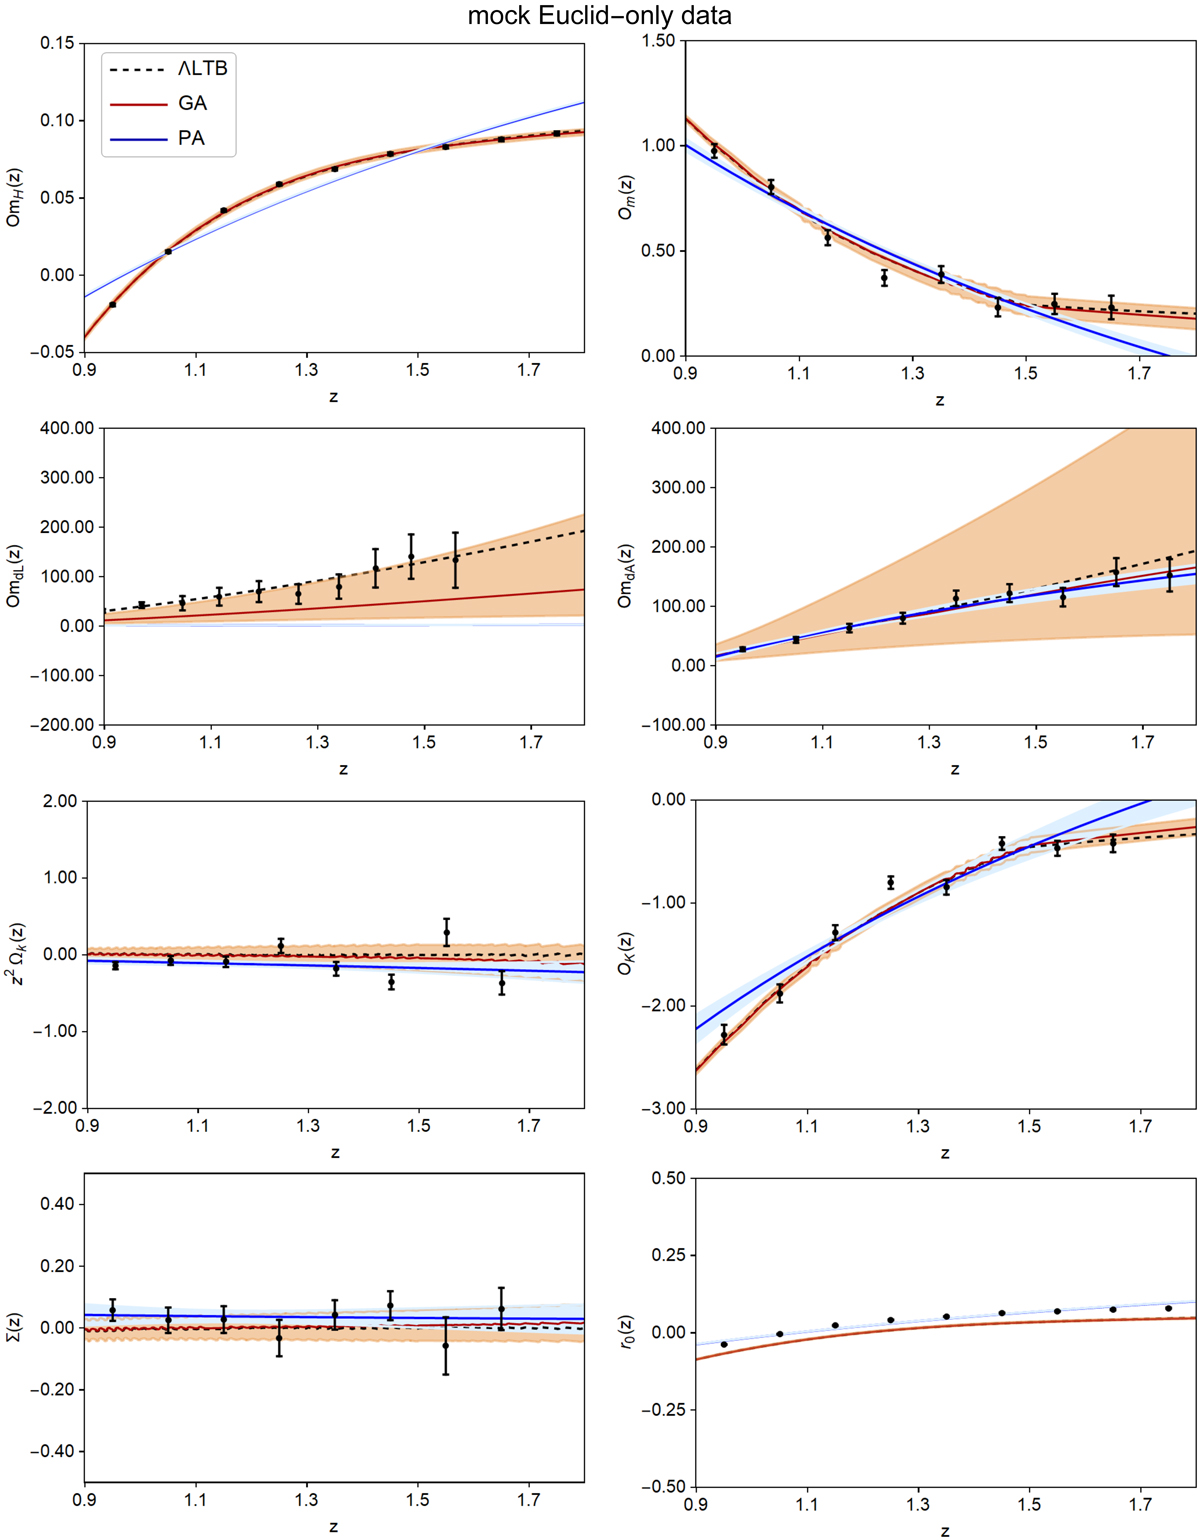
Fig. 8.
Download original image
GA reconstructions of the null tests mentioned in Sect. 3 using the Euclid-only BAO and Euclid + LSST SNe data for the ΛLTB mock. In all cases, the dashed line corresponds to the fiducial value of the corresponding test for the ΛLTB model, the red line is the GA fit, the blue line is the PA fit, the shaded regions correspond to the 68% uncertainties, and the black points correspond to the binned Euclid mock data.
Current usage metrics show cumulative count of Article Views (full-text article views including HTML views, PDF and ePub downloads, according to the available data) and Abstracts Views on Vision4Press platform.
Data correspond to usage on the plateform after 2015. The current usage metrics is available 48-96 hours after online publication and is updated daily on week days.
Initial download of the metrics may take a while.