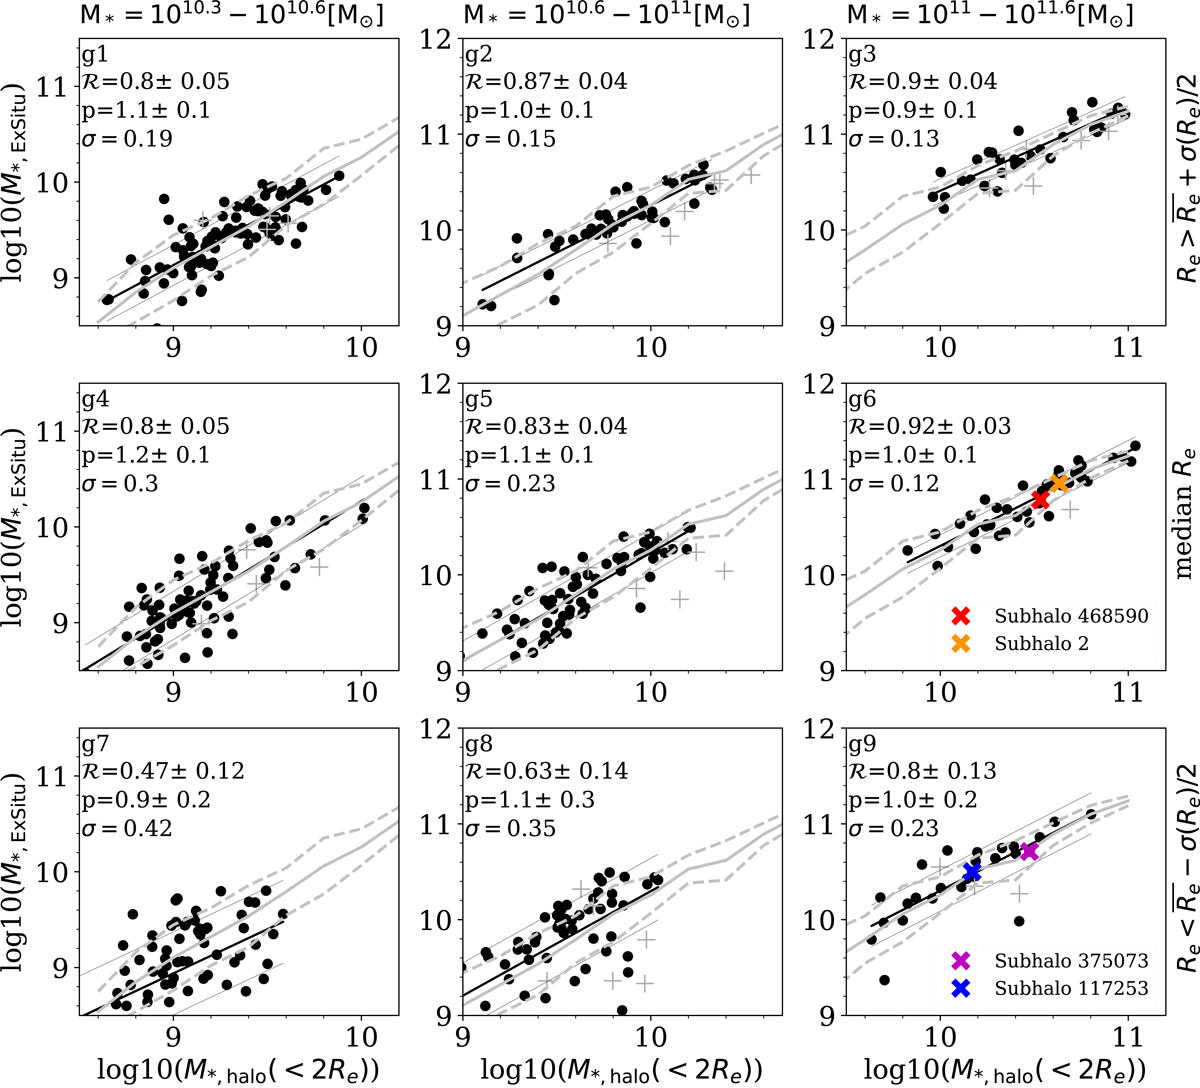
Fig. 7.
Download original image
Correlation between M*, halo(r < 2 Re) and the total ex situ stellar mass, M*, ExSitu, as a function of galaxy stellar mass and stellar size. Here we show the relationships for TNG50 galaxies divided into nine groups by mass and size, as shown in Fig. 1, one grouping per panel, with galaxy stellar mass increasing from left to right and galaxy stellar size increasing from bottom to top. In the middle row, galaxies of median size for their mass are depicted. The black dots denote TNG50 galaxies without ongoing mergers, whereas the gray plus symbols indicate ongoing mergers. The thick black line is a linear fit to the black dots, and the thin black lines represent the ±1σ scatter. The median and ±1σ scatter of the whole sample as shown in Fig. 5 are reproduced as gray curves for reference. The medium and ±1σ uncertainty of the Pearson correlation coefficient, ℛ(M*, halo(r < 2 Re), M*, ExSitu), slope of the linear fit, p, and the typical 1σ scatter of the data points against the linear fit are labeled for each group. The four galaxies that are discussed as case studies in Sect. 5 are marked with colored symbols (in panels g6 and g9).
Current usage metrics show cumulative count of Article Views (full-text article views including HTML views, PDF and ePub downloads, according to the available data) and Abstracts Views on Vision4Press platform.
Data correspond to usage on the plateform after 2015. The current usage metrics is available 48-96 hours after online publication and is updated daily on week days.
Initial download of the metrics may take a while.