Fig. 6.
Download original image
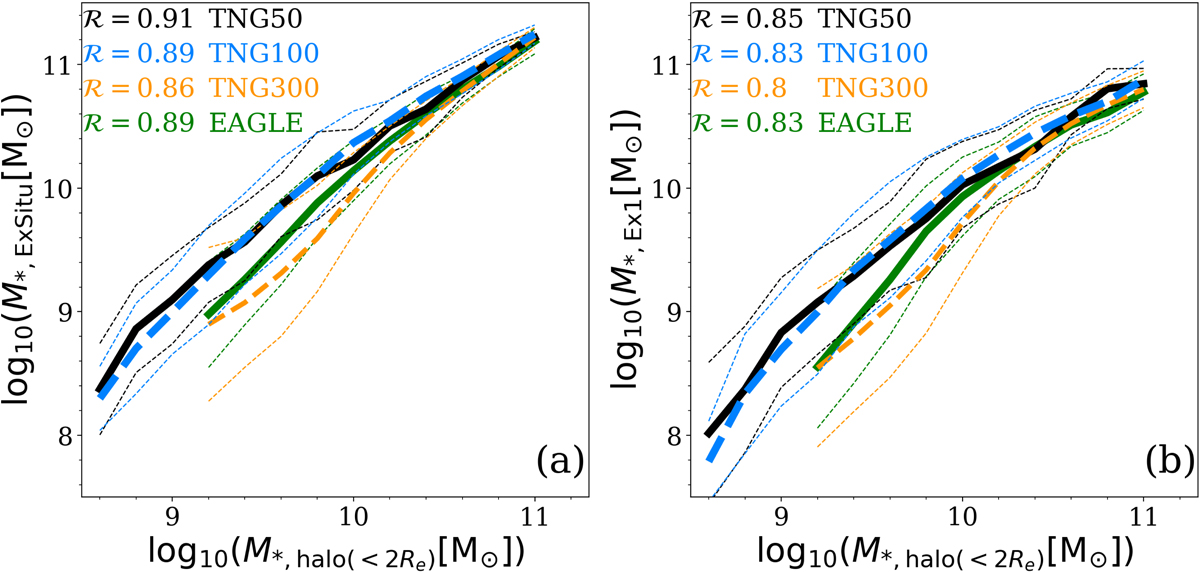
Information content of the hot inner stellar halo across galaxy formation simulations. We show the correlations of M*, halo(r < 2 Re) with the total ex situ stellar mass, M*, ExSitu (left), and with the stellar mass accreted from the most massive merger, M*, Ex1 (right), for different galaxy simulations. The thick black, blue, yellow, and green lines are the median curves from TNG50, TNG100, TNG300, and EAGLE galaxies at z = 0, respectively, in the M* = 1010.3 − 11.6 M⊙ range; the thin curves are the ±1σ scatters. The Pearson correlation coefficients, R, from the four sets of simulations are labeled in the corresponding colors.
Current usage metrics show cumulative count of Article Views (full-text article views including HTML views, PDF and ePub downloads, according to the available data) and Abstracts Views on Vision4Press platform.
Data correspond to usage on the plateform after 2015. The current usage metrics is available 48-96 hours after online publication and is updated daily on week days.
Initial download of the metrics may take a while.