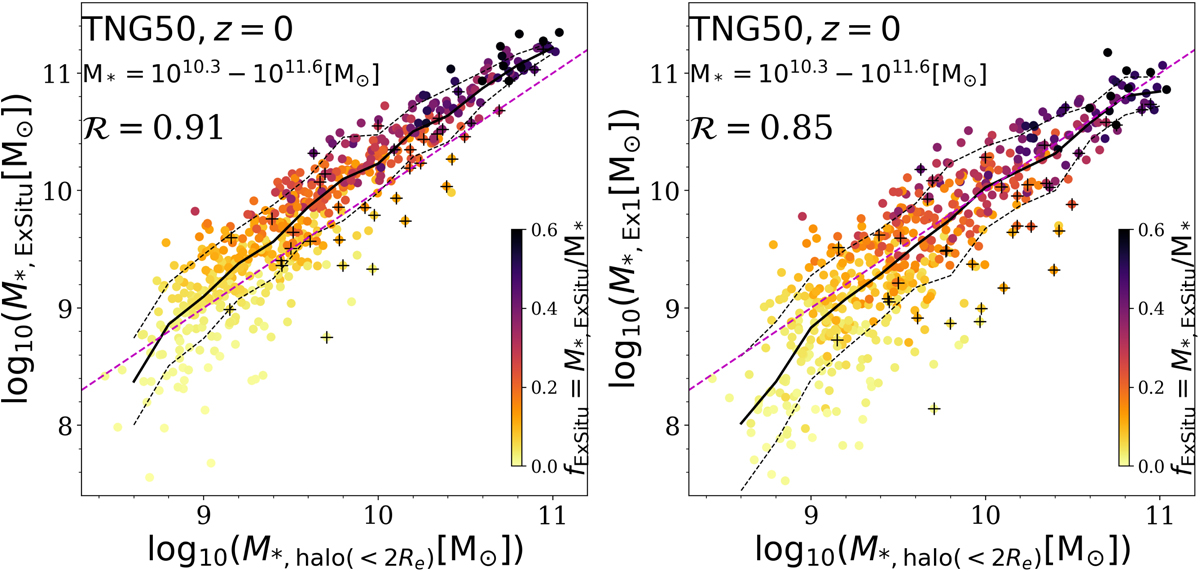
Fig. 5.
Download original image
Correlations between the mass of the hot inner stellar halo, M*, halo(r < 2 Re), and the total accreted stellar masses (left) and the stellar mass accreted from the most massive merger (right), according to TNG50. Left panel: M*, ExSitu includes all the ex situ stellar mass ever accreted from all past mergers and from the stripping of ongoing mergers, satellites, and flybys. Right panel: M*, ExSitu is the stellar mass accreted from the most massive merger. Here all galaxies with M* > 1010.3 from TNG50 at z = 0 are included, color coded by their stellar ex situ fraction. The thick black curve is the running median, and the thin dashed curves represent the ±1σ scatter. Black plus symbols mark galaxies with ongoing merging or those with counter-rotating disks. The Pearson correlation coefficients, ℛ, of the correlations are annotated in each panel. The dashed magenta line refers to 1:1. Some satellite mergers will deposit their stellar mass across a wide radius, with only a fraction of it within 2 Re, and so can lie above that line. On the other hand, the x axis shows a combination of in situ and ex situ stars such that the total mass can greatly exceed the total mass of the satellites in some galaxies with low ex situ fractions, causing them to lie below the line.
Current usage metrics show cumulative count of Article Views (full-text article views including HTML views, PDF and ePub downloads, according to the available data) and Abstracts Views on Vision4Press platform.
Data correspond to usage on the plateform after 2015. The current usage metrics is available 48-96 hours after online publication and is updated daily on week days.
Initial download of the metrics may take a while.