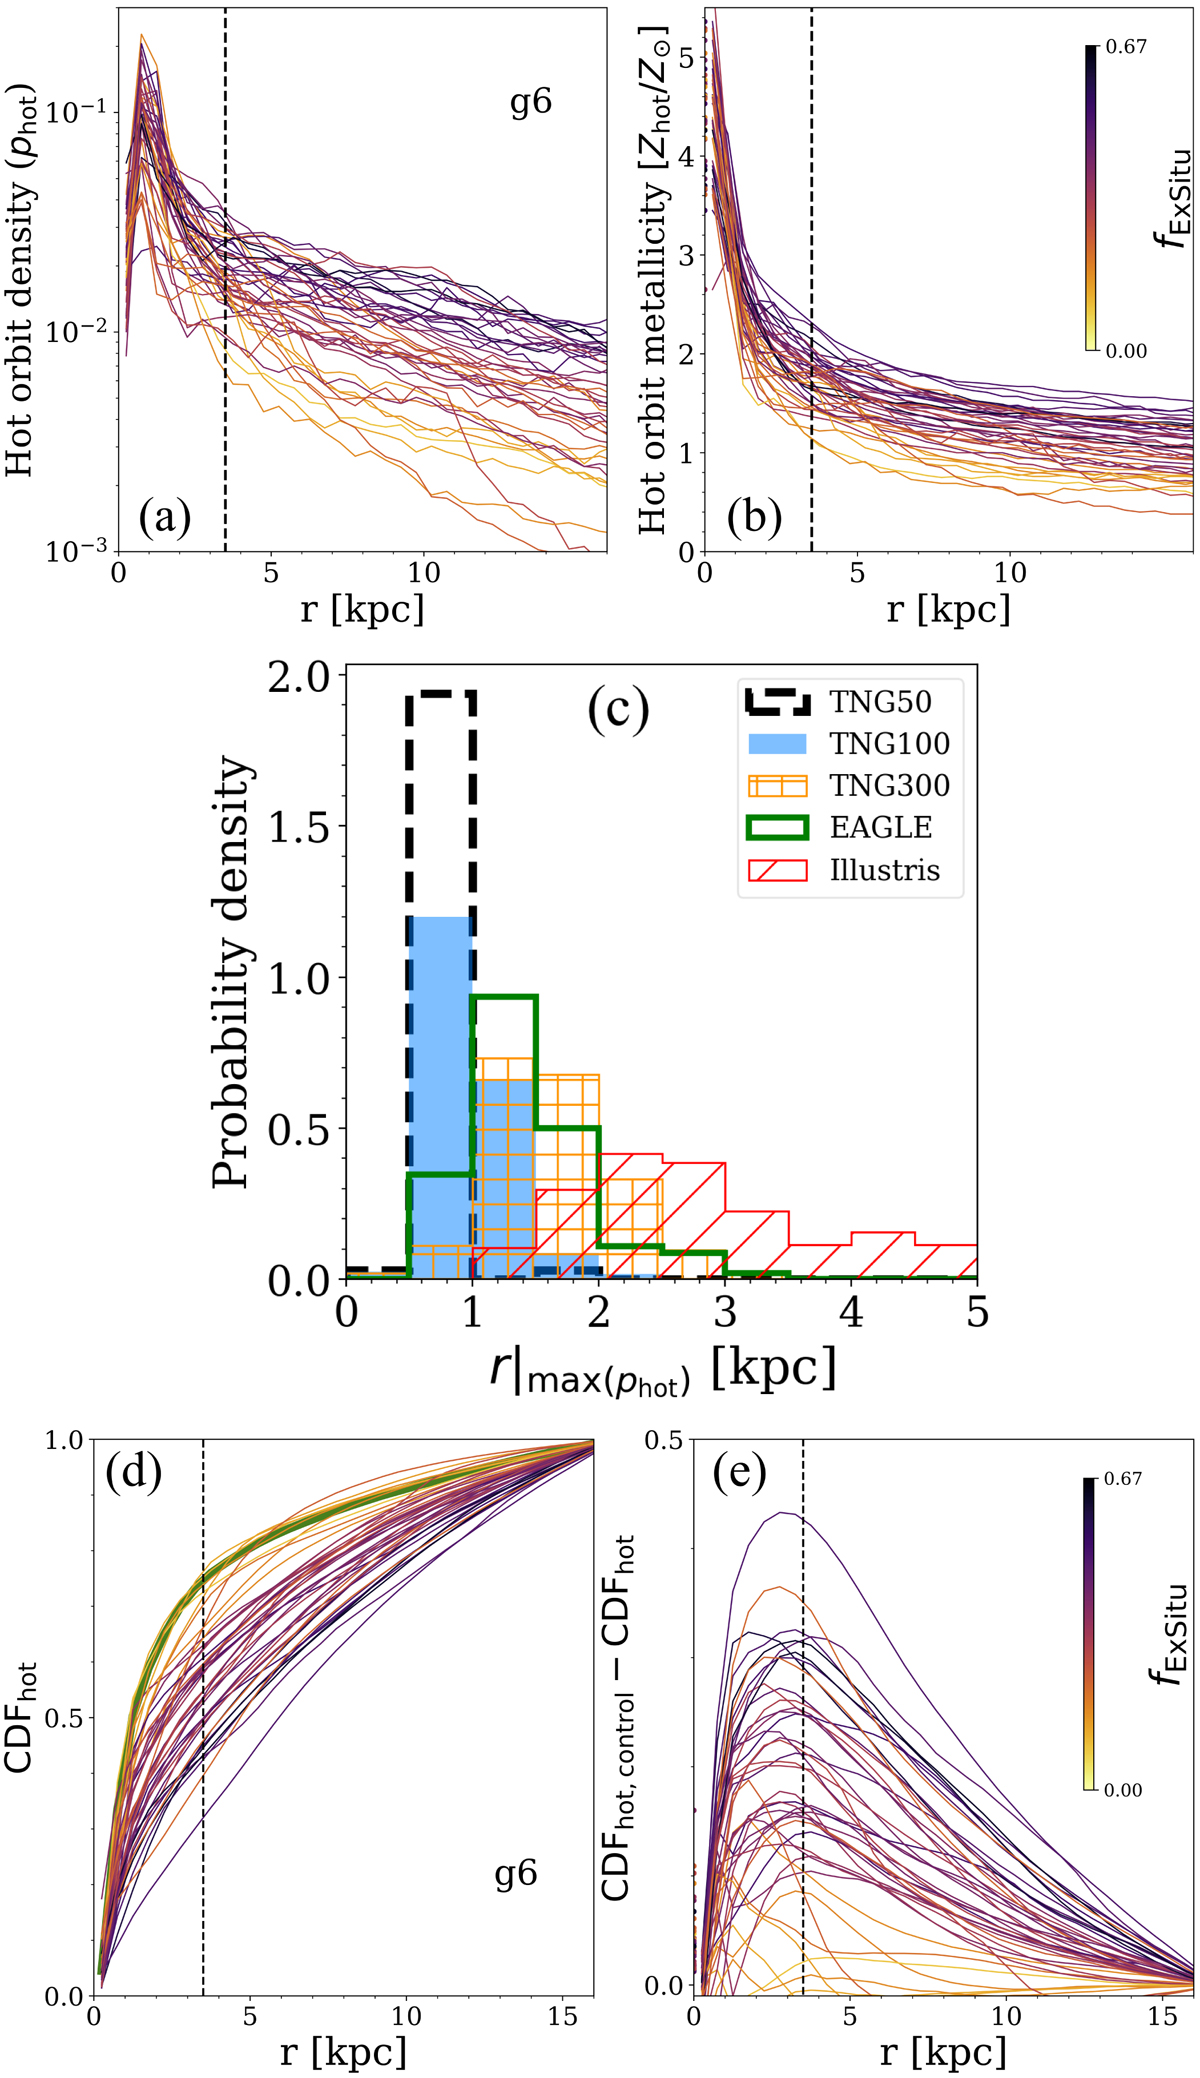
Fig. 3.
Download original image
Properties of the stellar orbit distributions of simulated galaxies and physical justification of the definition of hot inner stellar halo. Top: probability density distribution in panel a and the average metallicity in panel b, as a function of radius, r, obtained by summing up all the hot orbits with λz < 0.5 from a selection of TNG50 galaxies at z = 0, namely those in group g6 of Fig. 1. Each galaxy’s curve is color coded by the galaxy’s stellar ex situ fraction, as indicated by the colorbar. The vertical line indicates the radius rcut = 3.5 kpc, where both the probability density and metallicity profiles flatten. Middle: distributions of the radii where the probability density distribution of hot orbits peaks, r|max(phot), for galaxies with M* > 1010.3 M⊙ in the TNG50, TNG100, TNG300, EAGLE, and Illustris simulations. Most galaxies in TNG50 have r|max(phot) < 1.5 kpc, consistent with real galaxies from the Fornax3D survey. Galaxies in TNG100, TNG300, and EAGLE have slightly larger bulge sizes but still with r|max(phot) < 3.5 kpc. Bottom: panel d: cumulative distribution function of the hot orbits with λz < 0.5, CDFhot as a function of radius, r, for a selection of TNG50 galaxies. Symbols and selection are the same as in the top panels. The green curve represents the control model constructed by the galaxies with the lowest stellar ex situ fraction. Bottom: panel e: deviation of CDFhot from the control model, CDFhot, control. The vertical line indicates the radius rcut = 3.5 kpc, which we adopt throughout as the inner boundary of the hot inner stellar halo.
Current usage metrics show cumulative count of Article Views (full-text article views including HTML views, PDF and ePub downloads, according to the available data) and Abstracts Views on Vision4Press platform.
Data correspond to usage on the plateform after 2015. The current usage metrics is available 48-96 hours after online publication and is updated daily on week days.
Initial download of the metrics may take a while.