Free Access
Fig. B.1.
Download original image
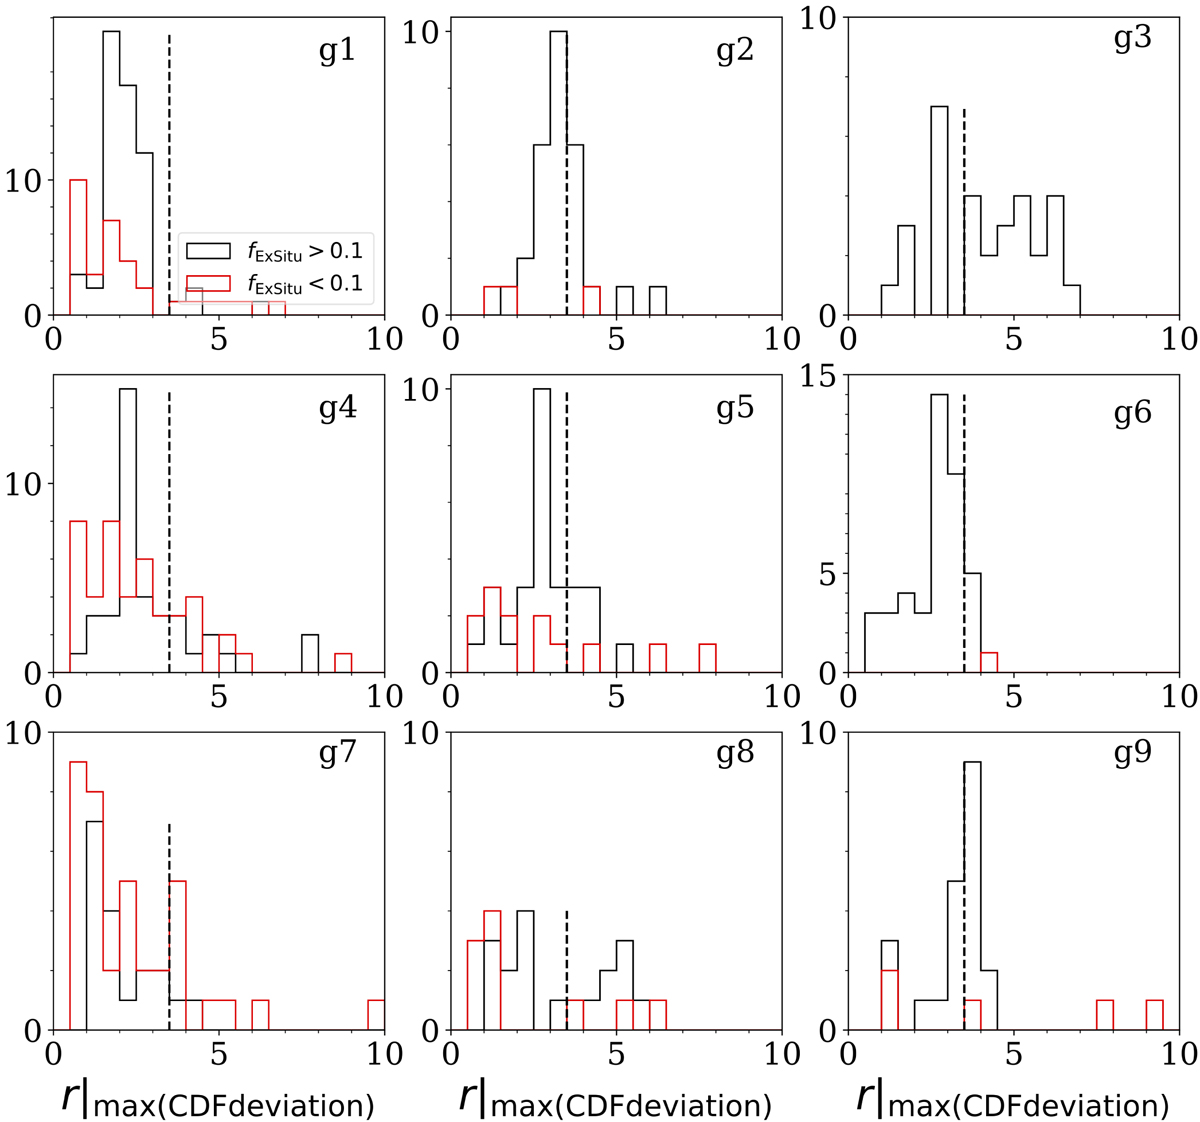
Distribution of r|max(CDF deviation), defined as the radius where CDFhot − CDFhot, control reaches the maximum, for TNG50 galaxies in g1-g9. The black histogram represents galaxies with higher ex situ fractions (fExSitu > 0.1), and the red histogram galaxies with low ex situ fraction (fExSitu < 0.1).
Current usage metrics show cumulative count of Article Views (full-text article views including HTML views, PDF and ePub downloads, according to the available data) and Abstracts Views on Vision4Press platform.
Data correspond to usage on the plateform after 2015. The current usage metrics is available 48-96 hours after online publication and is updated daily on week days.
Initial download of the metrics may take a while.