Fig. A.1.
Download original image
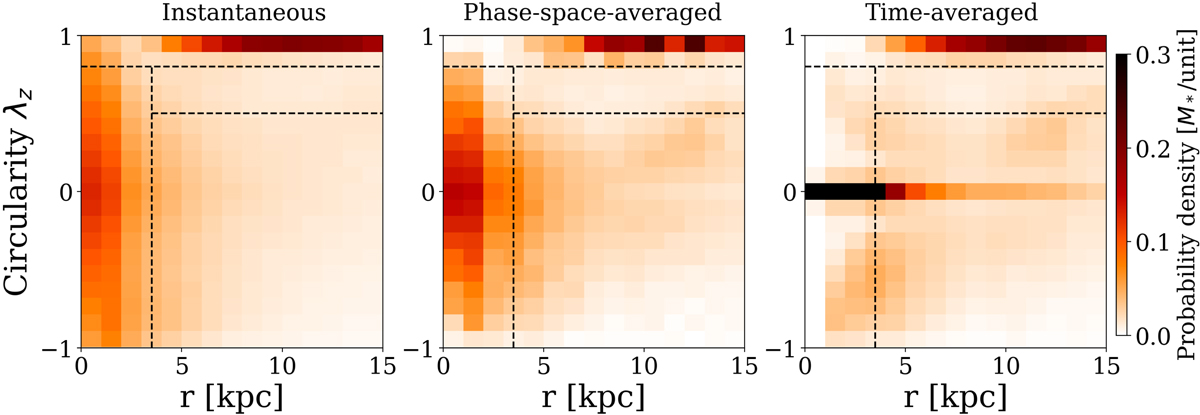
Stellar orbit distribution, p(r, λz), calculated in three different ways for an example galaxy from TNG50 at z = 0. In the left, r and λz are calculated from the instantaneous positions and velocities of particles at z = 0. In the middle, r and λz are phase-space-averaged. In the right, r and λz are time-averaged by integrating the orbits in the frozen potential. Most of the orbits in the bulge and in the hot inner stellar halo are on box orbits, and particles on the box orbits span a wide range of λz but with time-averaged values of zero. By doing a phase-space averaging, we can narrow down the λz distribution of particles on box orbits but cannot shrink them to zero.
Current usage metrics show cumulative count of Article Views (full-text article views including HTML views, PDF and ePub downloads, according to the available data) and Abstracts Views on Vision4Press platform.
Data correspond to usage on the plateform after 2015. The current usage metrics is available 48-96 hours after online publication and is updated daily on week days.
Initial download of the metrics may take a while.