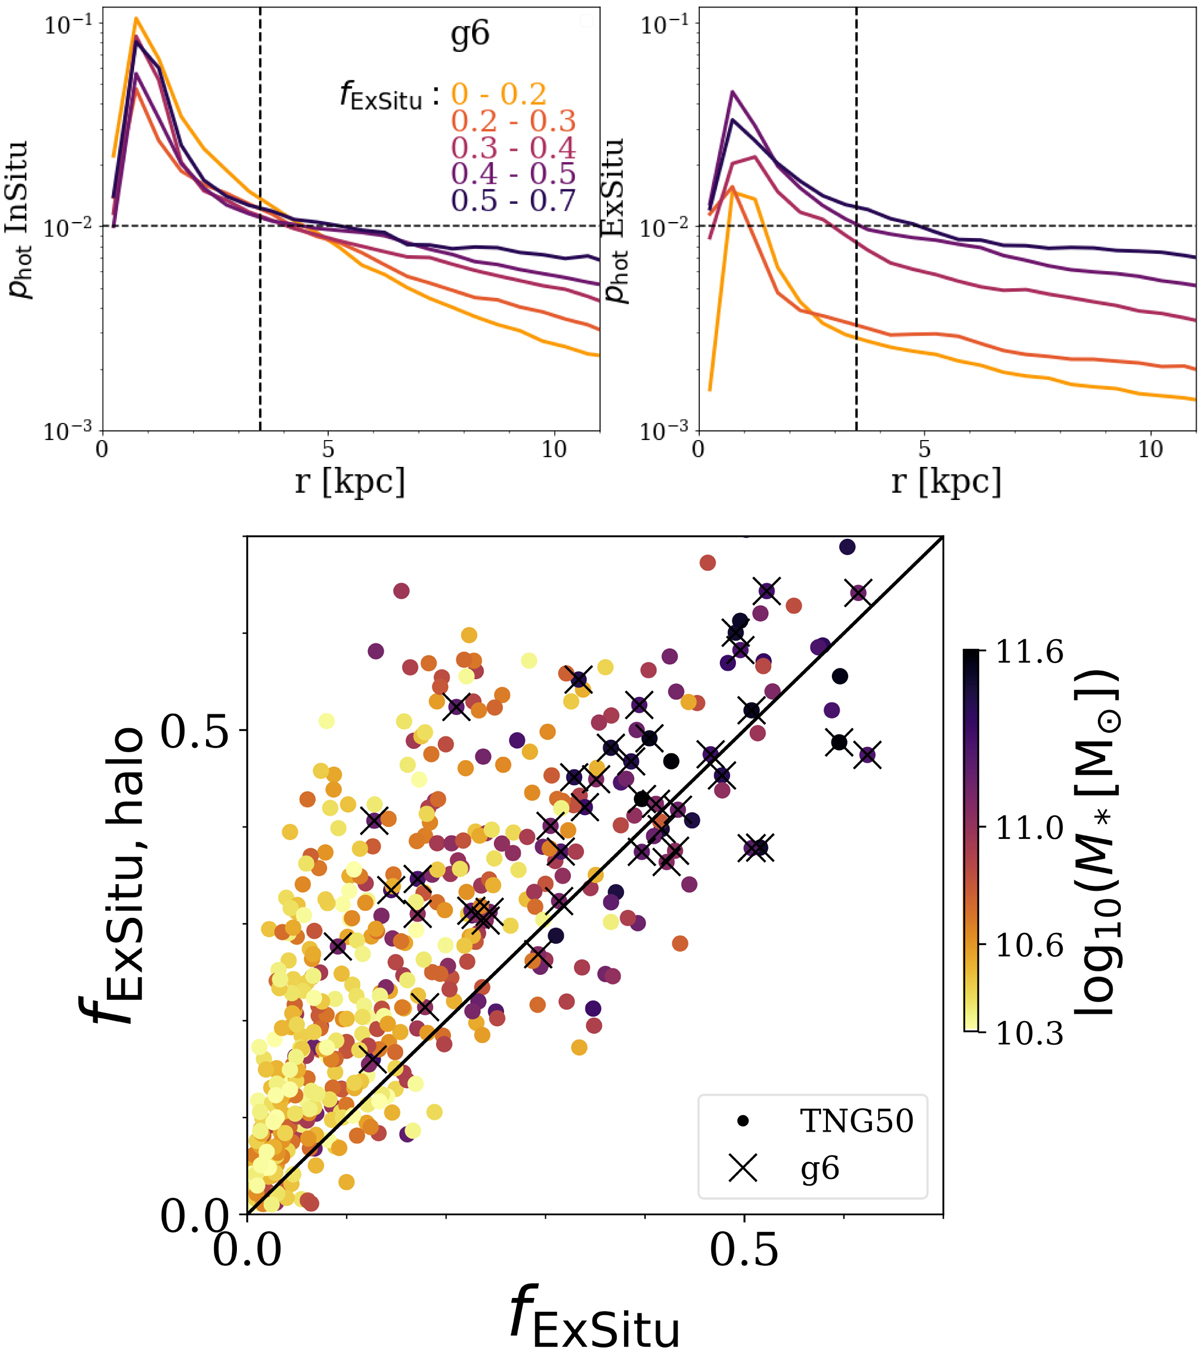
Fig. 12.
Download original image
Ex situ and in situ origin of the hot inner stellar halo of TNG50 galaxies. Top: probability density distribution of stars on hot orbits, for in situ (left) and ex situ (right) stars separately. Here we divide the subsample of TNG50 galaxies in g6 into five bins according to their ex situ fraction, fExSitu. Each curve represents the average phot (in situ or ex situ) of galaxies in each bin, color coded by its range of stellar ex situ fraction from 0−0.2 to 0.5−0.7, as indicated by the colored numbers. The curves are normalized such that the total probability of all stars within 2 Re equals unity. Bottom: stellar ex situ fraction of the galaxy, fExSitu, versus the ex situ fraction of stars in the hot inner stellar halo, fExSitu, halo (3.5 kpc < r < 2 Re and λz < 0.5). Each dot represents one galaxy in TNG50, color coded by galaxies stellar mass, M*, and crosses denote galaxies in subsample g6 (i.e., with a galaxy stellar mass in the range 1011 − 1011.6 and an average stellar size).
Current usage metrics show cumulative count of Article Views (full-text article views including HTML views, PDF and ePub downloads, according to the available data) and Abstracts Views on Vision4Press platform.
Data correspond to usage on the plateform after 2015. The current usage metrics is available 48-96 hours after online publication and is updated daily on week days.
Initial download of the metrics may take a while.