Fig. 1.
Download original image
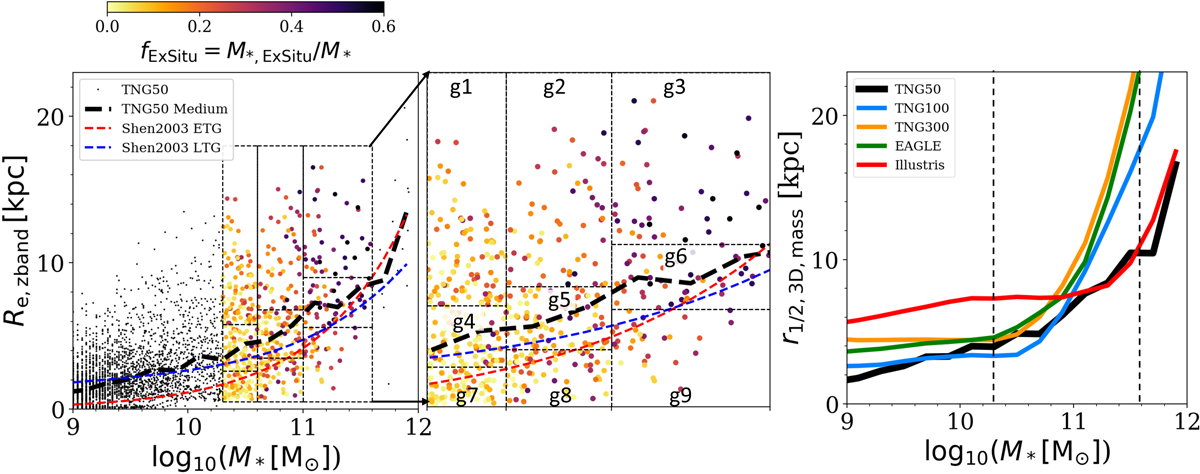
Stellar mass and size of the simulated galaxies analyzed in this paper. Left and central panels: total stellar mass, M*, versus projected half-light size in the z band, Re, z band, of TNG50 galaxies at z = 0. The dashed black curve is the median size of TNG50 galaxies as a function of M*. The red and blue curves show the median sizes of early-type and late-type SDSS galaxies (Shen et al. 2003) for reference. TNG50 galaxies with 1010.3 < M* < 1011.6 M⊙ are color coded by their stellar ex situ fraction (see also the zoomed-in version in the middle panel). The ex situ fraction systematically increases with increasing stellar mass and size. However, there are still large variations among galaxies of similar mass and size. We further divide the TNG50 samples into nine subsamples as indicated by the dashed squares labeled g1–g9 from left to right and from top to bottom. Right panel: median stellar sizes as a function of M* for TNG50, TNG100, TNG300, EAGLE, and Illustris galaxies at z = 0. Here we use the 3D half-mass size, r1/2, 3D, mass, for all galaxies. The vertical dashed lines mark the mass regions we focus on in this paper.
Current usage metrics show cumulative count of Article Views (full-text article views including HTML views, PDF and ePub downloads, according to the available data) and Abstracts Views on Vision4Press platform.
Data correspond to usage on the plateform after 2015. The current usage metrics is available 48-96 hours after online publication and is updated daily on week days.
Initial download of the metrics may take a while.